Data Quality & Project Performance Dashboard Report 2026
Explore key insights on workload analysis, defect rate monitoring, and risk identification across 10 major projects using BI analytics.
DATA QUALITY & PROJECT PERFORMANCE DASHBOARD
Workload Analysis · Defect Rate Monitoring · Risk & Opportunity Identification
April 2026 | BI Analytics Report
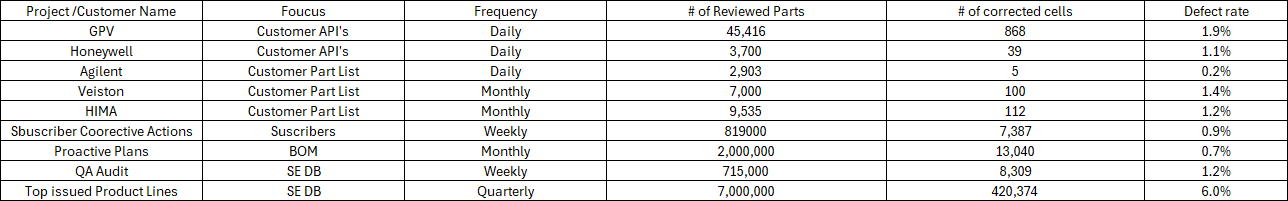
Raw Dataset Overview
Source data covering 10 projects with 6 key metrics used to drive all visualizations in this dashboard.
10 Projects / Customers
4 Frequency Types (Daily → Quarterly)
5 Focus Areas (API, Parts, BOM, Subscribers, SE DB)
Defect Range: 0.2% (Agilent) → 100% (Internal Test)
Columns: Project Name · Focus · Frequency · # Reviewed Parts · # Corrected Cells · Defect Rate
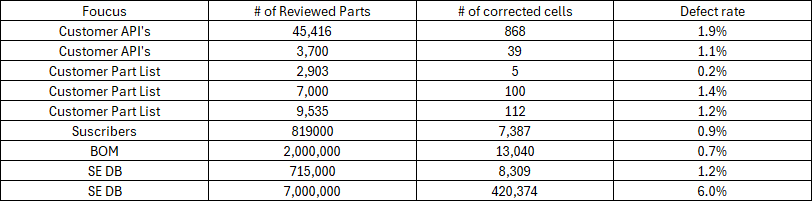
FOCUS AREA SUMMARY
Aggregated metrics grouped by Focus Area
5 Distinct Focus Areas
SE DB: Highest Volume (7.7M+ reviewed)
BOM: Best Efficiency at scale (0.7% defect)
Customer Part List: Most Consistent Quality
Focus Area Breakdown | Project Quality Dashboard | April 2026
KEY PERFORMANCE INDICATORS
10,603,380
Total Reviewed Parts
451,060
Total Corrected Cells
11.4%
Average Defect Rate
Excl. Internal Test: 2.1%
100%
Highest Defect Rate
⚠ Internal Test
0.2%
Lowest Defect Rate
✓ Agilent
Dataset: 10 projects | Frequencies: Daily · Weekly · Monthly · Quarterly
DEFECT RATE BY PROJECT (%)
Identifying quality outliers across all projects
Internal Test excluded from overall avg. (100% = test environment anomaly)
WORKLOAD DISTRIBUTION — REVIEWED PARTS BY PROJECT
Volume processed per project
Total Reviewed: 10,603,380 parts
VOLUME vs. DEFECT RATE — CORRELATION ANALYSIS
Does higher workload lead to more defects?
REVIEWED vs. CORRECTED CELLS BY FOCUS AREA
DISTRIBUTION BY REVIEW FREQUENCY
907
49,116
317
19,438
7,387
819,000
13,040
2,000,000
430,509
7,716,826
10
Projects
(30%)
3 Projects
(40%)
4 Projects
(30%)
3 Projects
(10%)
1 Project
KEY INSIGHTS & BUSINESS RECOMMENDATIONS
⚠️
CRITICAL — Internal Test
100% defect rate detected. All 1,826 reviewed parts flagged as defective. Immediate investigation required — possible test environment misconfiguration.
🔴
HIGH RISK — Top Issued Product Lines
Highest workload (7M parts) combined with 6% defect rate. 420,374 corrected cells. Most critical area — requires priority resource allocation.
✅
STRONG PERFORMANCE — Proactive Plans
2M parts reviewed with only 0.7% defect rate (13,040 corrections). High volume handled efficiently — a model for scalable quality control.
✅
CONTROLLED — Subscriber Corrective Actions
819K parts with sub-1% defect rate (0.9%). Large workload managed with strong quality discipline.
💎
HIGH QUALITY — Low-Volume Projects
Agilent (0.2%), Honeywell (1.1%), and Veiston (1.4%) maintain excellent quality at lower volumes. Best-in-class accuracy.
📊
KEY FINDING — No Volume-Defect Correlation
High review volume does NOT guarantee high defect rates. Quality is driven by process discipline, not volume alone.
Dashboard generated: April 2026 | Source: Project Quality Dataset
- data-quality
- project-management
- bi-analytics
- defect-rate
- workload-analysis
- kpi-dashboard
- business-intelligence