
2008 Financial Crisis: Quantitative Analysis & Model Failures
Explore the mathematical causes of the 2008 financial crisis, including Gaussian Copula failures, CDOs, leverage risks, and systemic economic impacts.
The 2008 Global Financial Crisis
A Quantitative Analysis of Causes and Impacts
Perspective: Systemic Risk & Model Failure
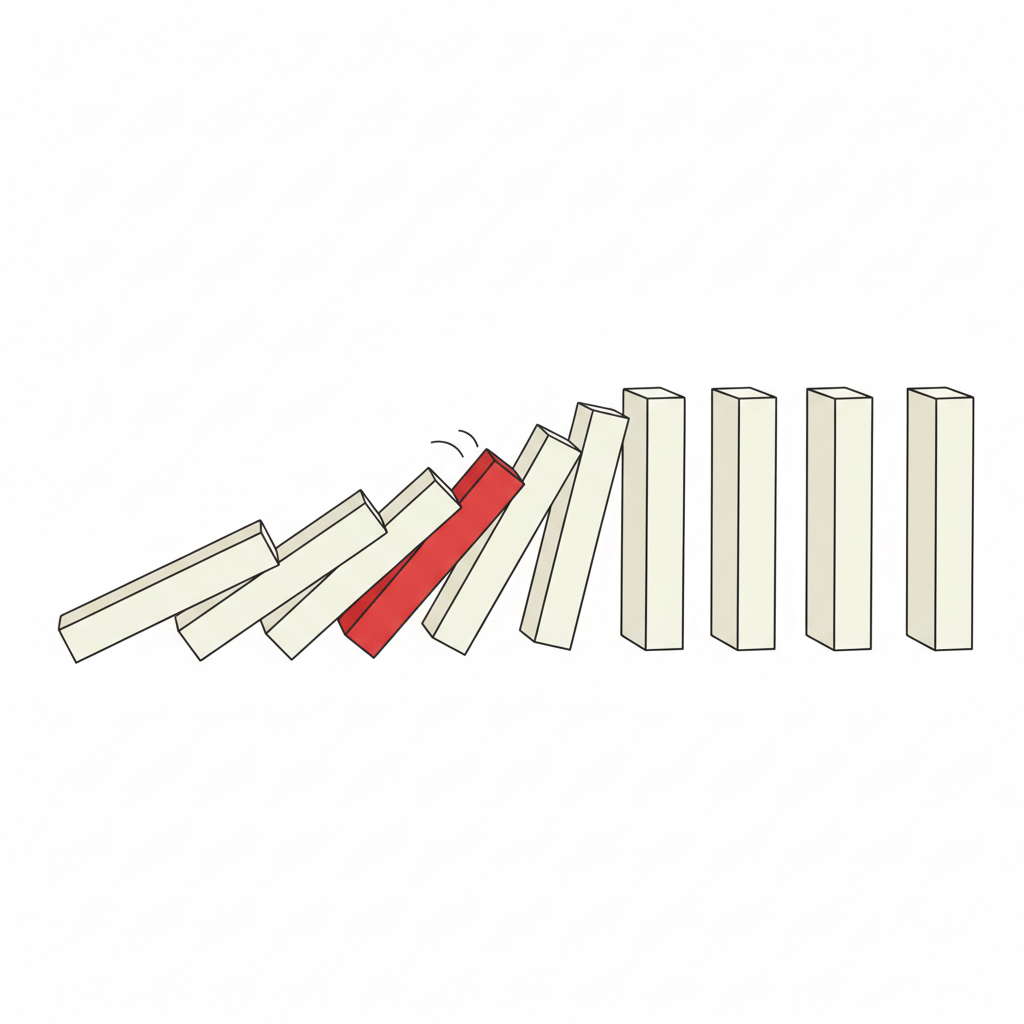
Crisis Timeline & Propagation
2000–2006: Housing boom & credit expansion
2006–2007: Rising mortgage defaults begin
2008: Lehman Brothers collapse → Global Panic
2009: Deep global recession
Housing Bubble: The Divergence
The Case-Shiller Home Price Index showed prices decoupling from historical norms (income and rents) starting in 2000.
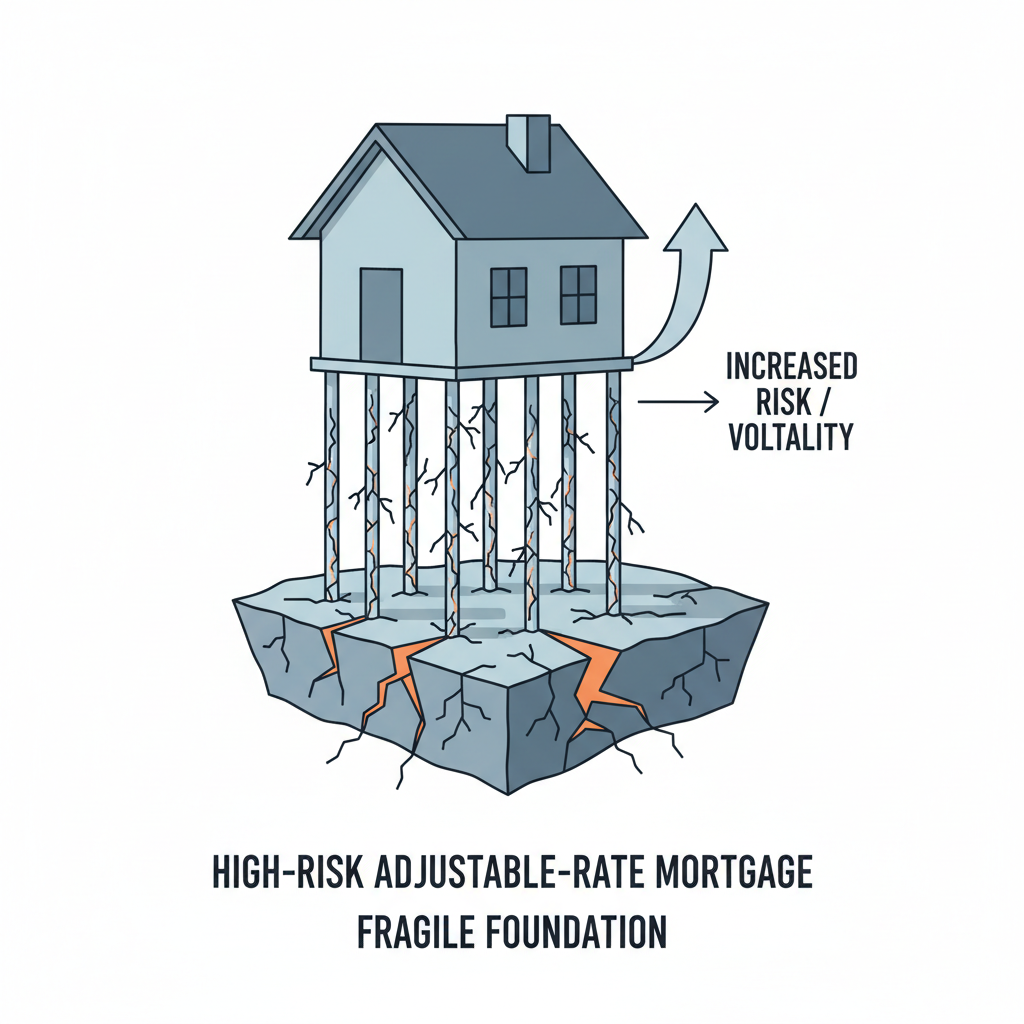
Subprime Mortgages & Default Probability
High-risk borrowers with no income verification (NINJA loans).
High Loan-to-Value (LTV) ratios left no equity cushion.
Adjustable-Rate Mortgages (ARMs) triggered defaults when rates reset.
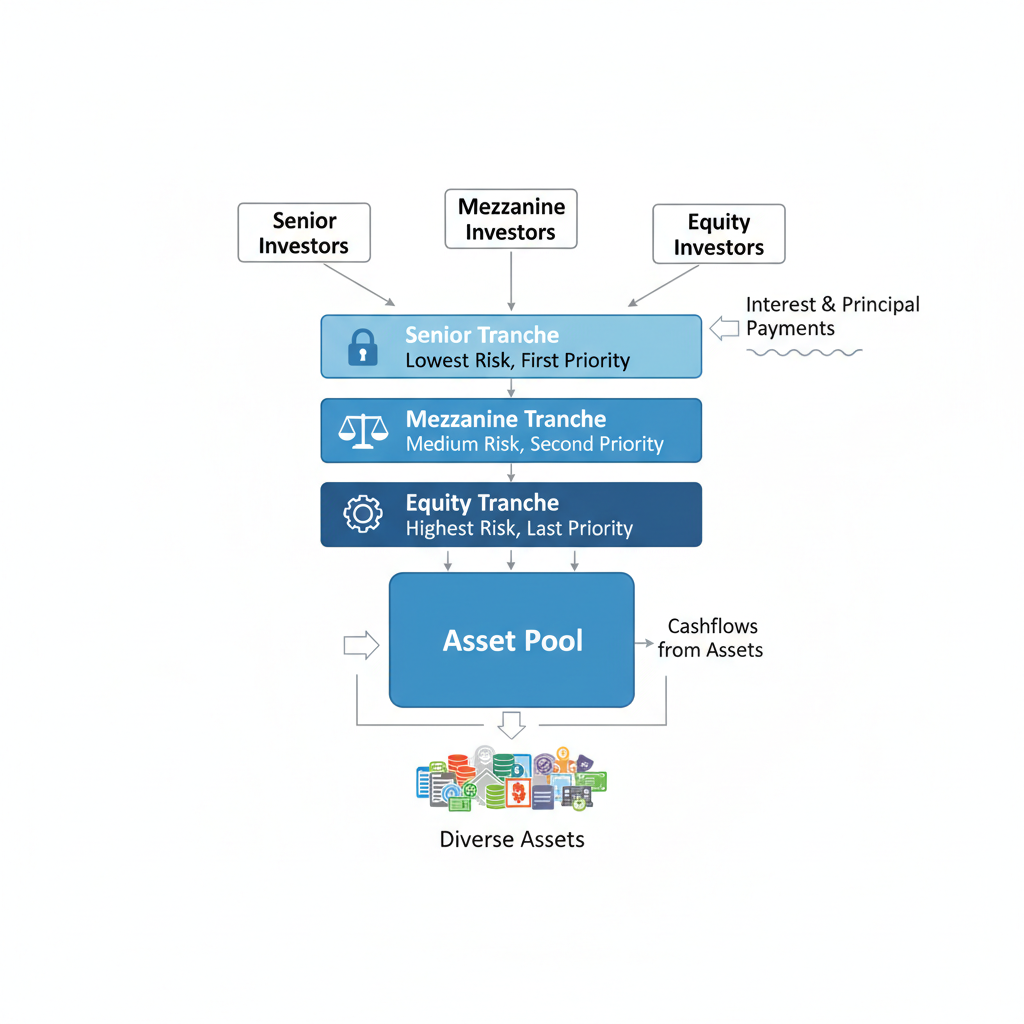
The Illusion of Diversification: CDOs
Mortgage-Backed Securities (MBS) pooled thousands of loans.
CDOs sliced these pools into 'tranches' based on risk preference.
Assumption: Geographical diversification reduces joint default risk.
The Culprit: Gaussian Copula
P(joint default) = Φ_ρ ( Φ⁻¹(p₁), ... , Φ⁻¹(pₙ) )
Used to price CDOs by estimating the probability of simultaneous defaults.
ρ (Rho): The Correlation Parameter
If ρ is low, tranches seem safe. If ρ spikes to 1, the model collapses.
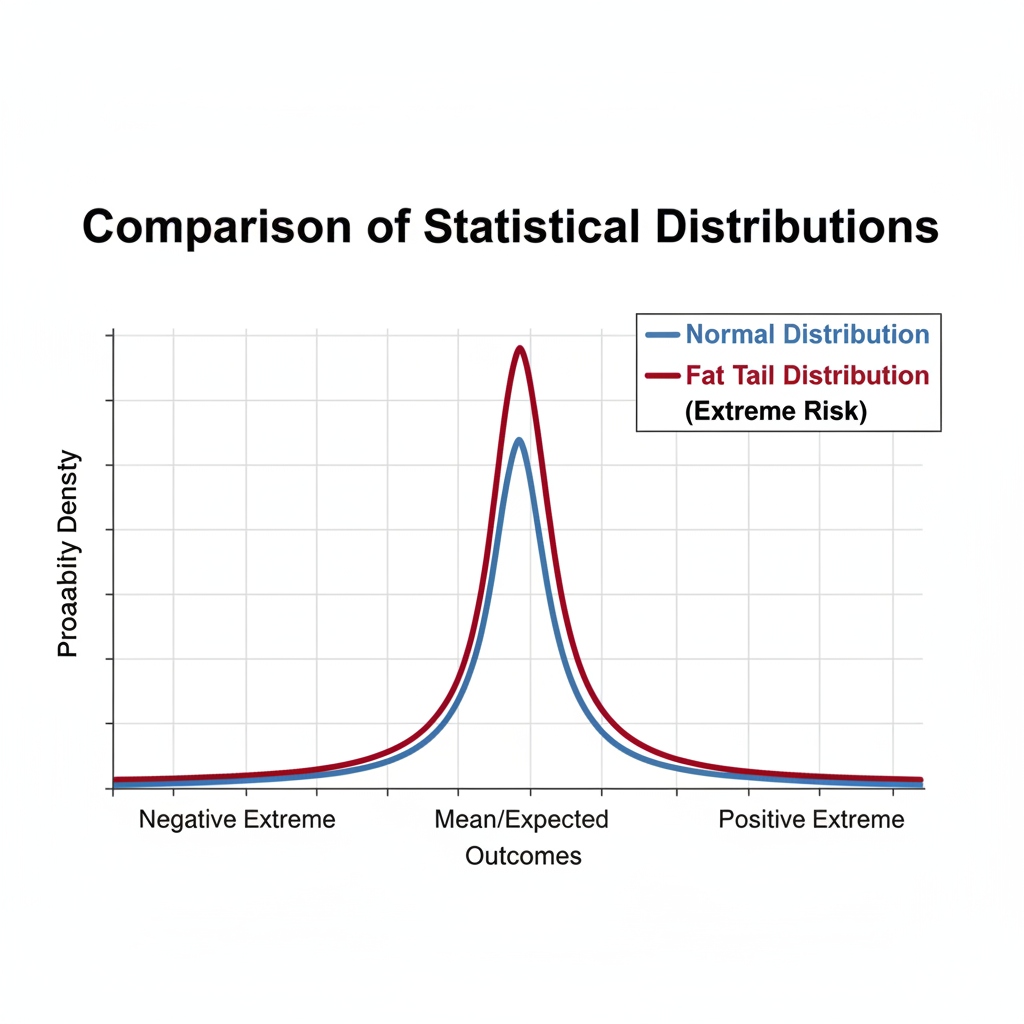
Why the Model Failed
Historical Bias: Data only covered the housing boom (short memory).
Thin Tails: Gaussian distributions underestimate extreme events.
Dynamic Correlation: In a crisis, correlations trend toward 1.0.
Leverage: The Magnifier
Leverage = Total Assets / Equity
With 30x leverage, a mere 3.3% drop in asset value wipes out 100% of equity.
Economic Impact: The Real Economy
ΔGDP ≈ α + β(Credit Spreads) + ε
As credit markets froze, the real economy crashed. US Unemployment doubled in two years.
Lessons for Quantitative Finance
Models are tools, not truth.
Correlation ≠ Causation (and correlation is not constant).
Stress Testing: Always test for 'impossible' scenarios.
"Quantitative methods should support judgment, not replace it."
- financial-crisis
- quantitative-finance
- systemic-risk
- economics
- housing-bubble
- risk-management
- statistics