


Kinetic Analysis of Hydrogen Peroxide-Iodide Reactions
Learn how to determine rate laws and activation energy for the Hydrogen Peroxide-Iodide reaction using graphical analysis and the Arrhenius equation.
Experiment #24: Determination of a Rate Law
Lab #5: Kinetic Analysis of the Hydrogen Peroxide-Iodide Reaction
[Name]
[Date]
Objectives & Background
Systematically determine the specific rate law governing the reaction between hydrogen peroxide and iodide ions.
utilize graphical analysis techniques to calculate reactant orders and compute the activation energy (Ea) for the reaction.
Chemical kinetics is the study of reaction rates. The rate of this reaction is primarily determined by two key factors: the concentration of reactants and the temperature of the environment. Any variation in these parameters will directly alter the speed at which the reaction proceeds.
The Chemical Reaction
3 I<sup>-</sup>(aq) + H<sub>2</sub>O<sub>2</sub>(aq) + 2H<sub>3</sub>O<sup>+</sup>(aq) → I<sub>3</sub><sup>-</sup>(aq) + 4H<sub>2</sub>O(l)
We use an <strong style="color:white; font-weight:600;">acetic acid-sodium acetate buffer</strong> to maintain a stable environment, keeping [H<sub>3</sub>O<sup>+</sup>] constant at <strong style="color:white; font-weight:600;">pH ~5</strong>.
Simplified Rate Law
Rate = k'[I<sup>-</sup>]<sup>p</sup>[H<sub>2</sub>O<sub>2</sub>]<sup>q</sup>
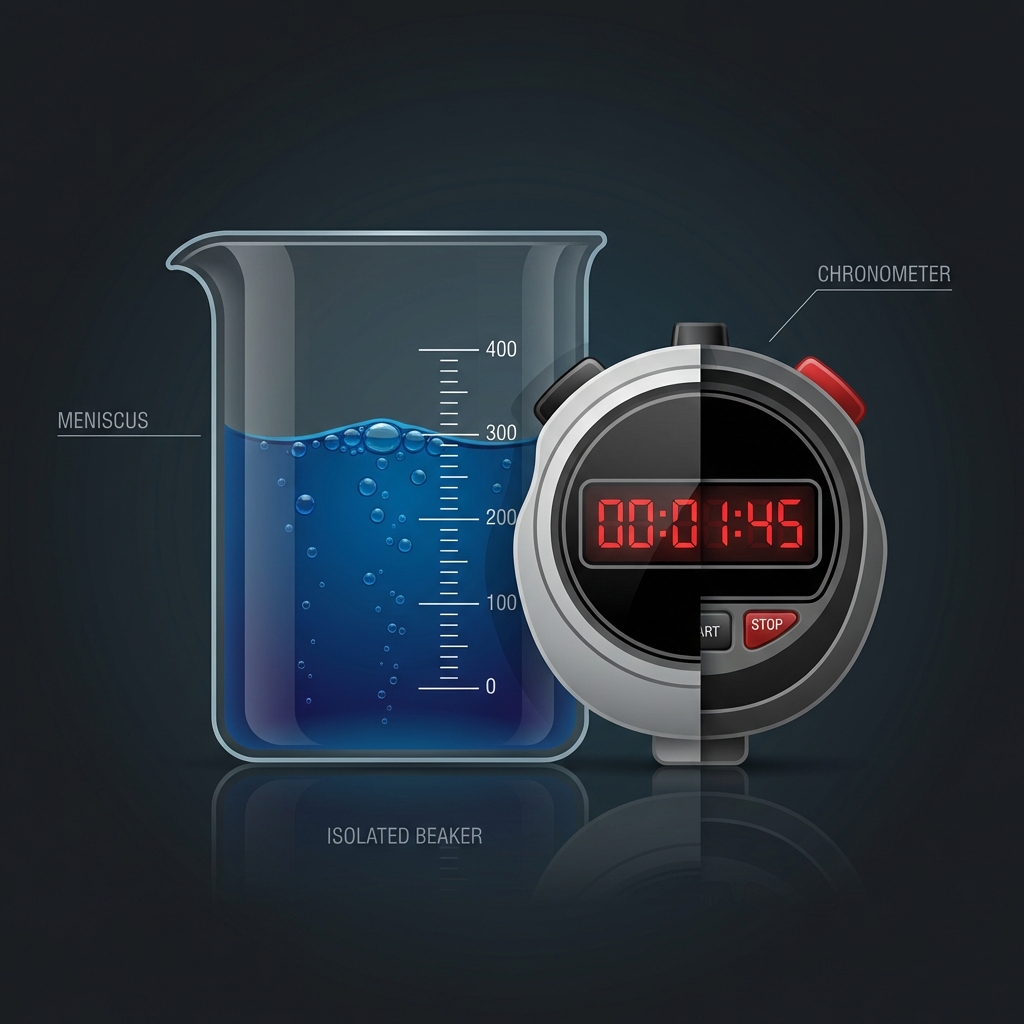
Experimental Design: The 'Clock' Reaction
We measure reaction rate indirectly by timing how long it takes for a fixed amount of thiosulfate (S₂O₃²⁻) to be consumed. Changes are invisible until the thiosulfate is gone.
The appearance of the blue color is sudden. Keep your eyes on the solution and be prepared to stop the timer immediately!
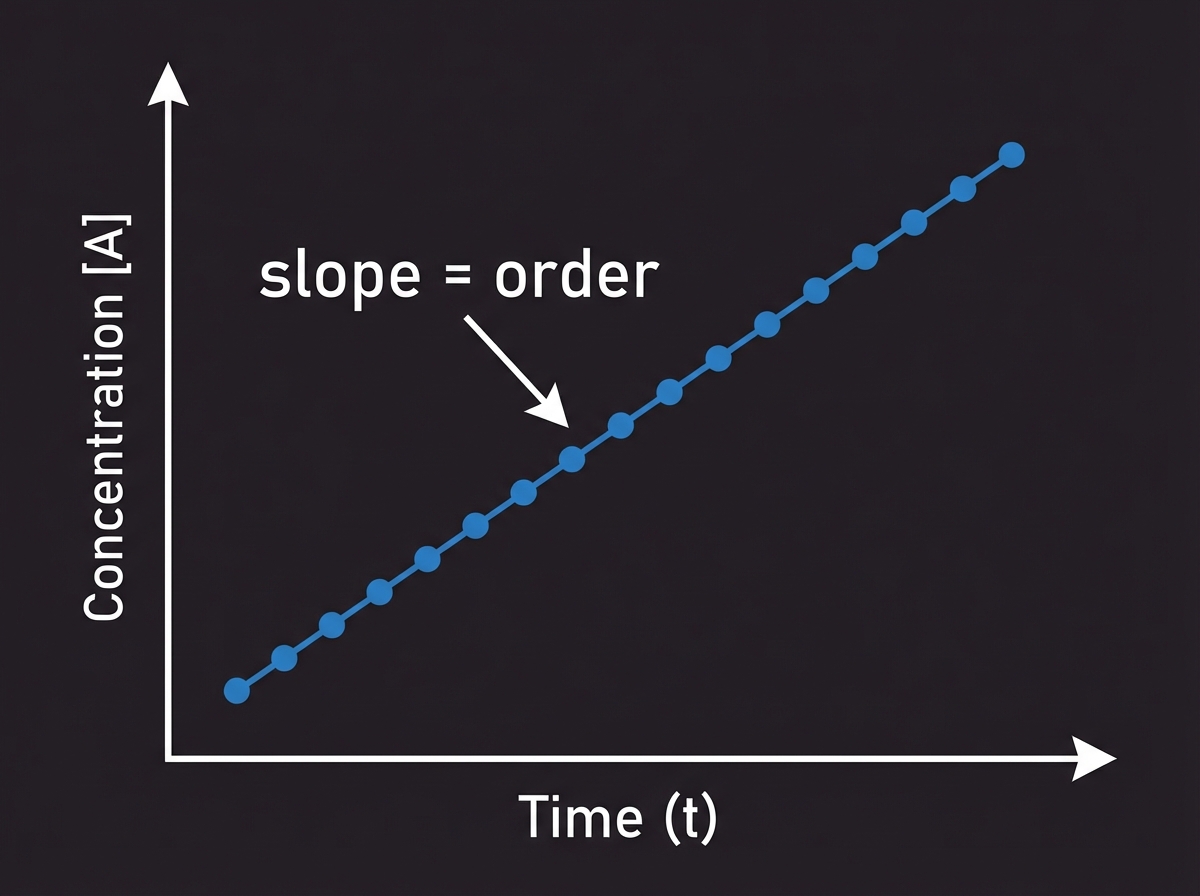
Graphical Analysis for p and q
The Semi-Logarithmic Approach
log(rate) = p · log[I⁻] + log C
log(rate) = q · log[H₂O₂] + log C'
The slope of these linear plots equals the reaction order (p or q).
Keep the total volume constant (10.0 mL) so you can use volumes or moles directly for rate calculations.
Arrhenius Equation & Activation Energy
8.314 J/mol·K
Temperature in Kelvins
Linearizing the Arrhenius equation by plotting ln k' versus 1/T yields a straight line related to activation energy.
Always convert temperature to Kelvin before plotting! (K = °C + 273.15)
GENERAL CHEMISTRY I
LABORATORY
Step-by-Step Procedure & Lab Tips
Outline for Part A and Part E
Prepare Solution A containing KI (Potassium Iodide), Starch, Thiosulfate, and Buffer.
Prepare Solution B containing H₂O₂ (Hydrogen Peroxide).
Mix Solutions A and B swiftly and start timing immediately upon contact.
Monitor Color Change
Place a white sheet of paper under the beaker. It makes the sudden blue-black color shift much easier to detect.
Mixing Technique
Do not swirl continuously during the reaction. Swirl once vigorously to mix, then let it sit undisturbed.
Thermal Equilibrium (Part E)
Temperature is critical. Allow solutions to sit in the water bath for at least 5 minutes before mixing.
Part A: Determination of Reaction Orders
Detailed Procedure for Reagent Preparation, Mixing, and Data Collection
Prepare stock solutions with precise concentrations: 0.040 M KI (Potassium Iodide) and 0.040 M H₂O₂ (Hydrogen Peroxide). Ensure glassware is clean.
Initiate the reaction: Pour Solution A (KI, Starch, Na₂S₂O₃, Buffer) swiftly into Solution B (H₂O₂). The 'Clock' starts upon contact.
Start timing immediately. Measuring to the nearest second, record the time elapsed until the solution suddenly turns blue-black.
Repeat with varying volumes of KI/H₂O₂. Use Deionized (DI) water to keep total reaction volume constant, allowing isolation of variables p and q.
Part E: Temperature Dependence
Activation Energy Determination Protocol
Water Bath Setup
Prepare two distinct environments: an ice bath (~4°C) and a hot water bath (~40°C) to create a wide temperature range.
Thermal Equilibrium
IMPORTANT: Place separate test tubes of Solution A and B into the bath for >5 mins BEFORE mixing.
Record Temperature
Measure the temperature of the mixture immediately after the color change. This is your T value for the Arrhenius plot.
Precision is Paramount
Temperature is the primary variable here. Small deviations have a massive impact on the rate constant (k).
Create Data Spread
You need clear 'cold' and 'hot' data points to generate a valid slope for calculating Activation Energy (Ea).
Reaction Rate Changes
Be ready: Cold reactions may take much longer, while hot reactions will occur very rapidly.
Troubleshooting the Iodine Clock
Common Pitfalls & Solutions
No Color Change
Check if Starch or Na₂S₂O₃ was omitted from the mixture. Without starch, the iodine complex cannot form visible color.
Instant Color Change
Check if Na₂S₂O₃ was forgotten (iodine forms immediately) or if H₂O₂ reactant was contaminated.
Inconsistent Times
Ensure beakers are perfectly clean. Contaminants affect rate. Rinse thoroughly with DI water between every trial.
Calculation Errors
Use Molarity of the FINAL mixture, not the stock solution. Dilution equation M₁V₁ = M₂V₂ is critical here.
- chemistry-lab
- chemical-kinetics
- rate-law
- activation-energy
- arrhenius-equation
- iodine-clock
- experimental-chemistry