


Mastering Statistical Inference: Estimation & Testing
Learn key concepts of statistical inference, including point and interval estimation, confidence intervals, and hypothesis testing with worked examples.
Statistical Inference I
Module 4: Estimation, Hypothesis Testing & Examples
What is Statistical Inference?
Statistical inference is the process of using data analysis to infer properties of an underlying population probability distribution. It allows us to draw conclusions about a large population based on a smaller sample.
Point vs. Interval Estimation
In statistical inference, we estimate population parameters in two ways:<br><br><b>1. Point Estimation:</b> A single value calculated from sample data (e.g., Sample Mean x̄) used to estimate the population parameter (μ).<br><br><b>2. Interval Estimation:</b> A range of values (e.g., Confidence Interval) within which the parameter is expected to lie with a certain probability.
Confidence Intervals
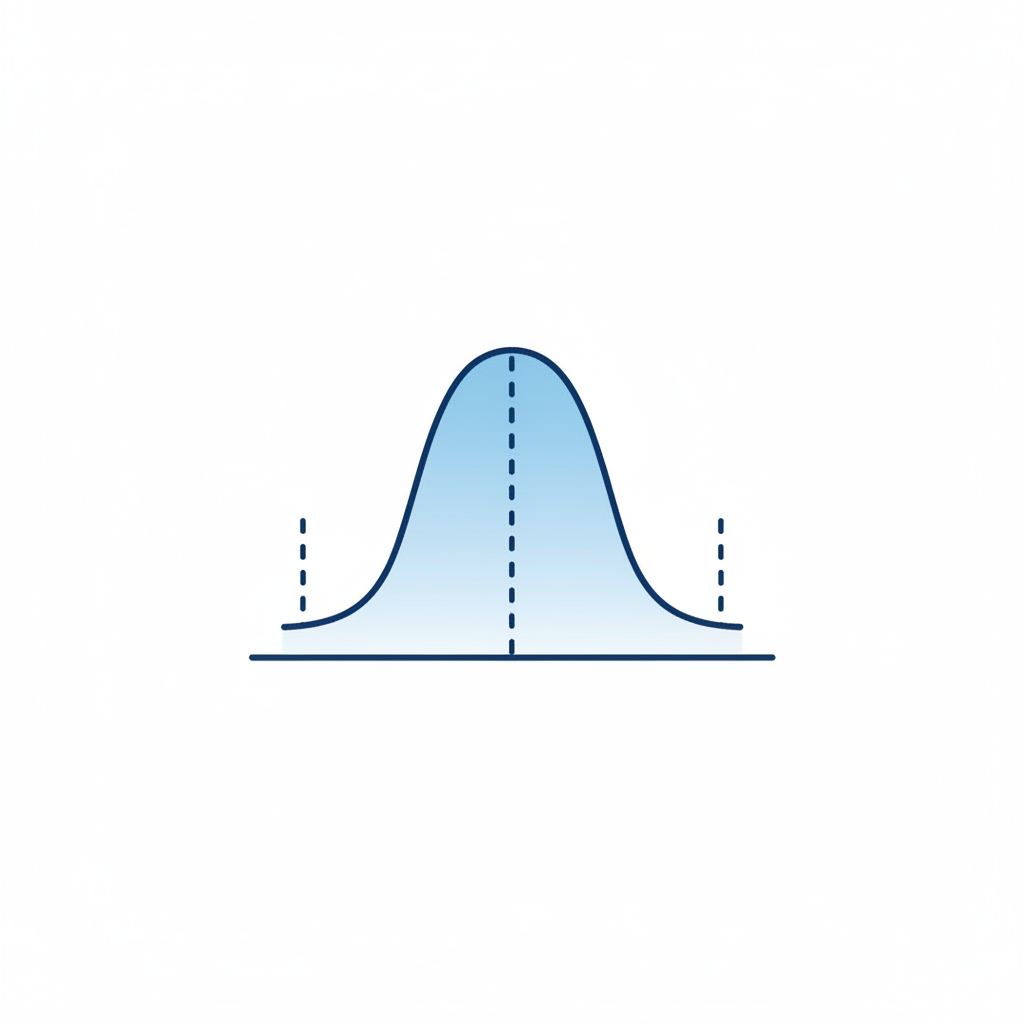
A Confidence Interval (CI) proposes a range of plausible values for an unknown parameter. For a 95% CI, if we were to take 100 different samples and compute a CI for each, we expect 95 of those intervals to contain the true population mean.
Example Sum 1: Finding 95% CI
Problem: A sample of 64 students has a mean score of 50 with a known standard deviation of 8. Find the 95% confidence interval for the population mean.
Step 1: Calculate Standard Error (SE) = σ / √n = 8 / √64 = 8 / 8 = 1.0
Step 2: Z-value for 95% confidence is 1.96
Step 3: Margin of Error (E) = Z * SE = 1.96 * 1.0 = 1.96
Result: CI = Mean ± E = 50 ± 1.96 ⇒ [48.04, 51.96]
Hypothesis Testing Basics
Hypothesis testing evaluates two mutually exclusive statements about a population:<br><br><b>Null Hypothesis (H₀):</b> Theoretical statement of no effect or no difference.<br><b>Alternative Hypothesis (H₁):</b> Statement trying to be proven (there is an effect).<br><br>We use sample data to determine if there is sufficient evidence to reject H₀.
Types of Errors in Testing
In decision making, we can make two types of errors:
Type I Error (α): Rejecting the Null Hypothesis when it is actually true (False Positive).
Type II Error (β): Failing to reject the Null Hypothesis when it is actually false (False Negative).
Significance Level (α): The probability of committing a Type I error (commonly 0.05).
The P-value is the probability of obtaining test results at least as extreme as the results actually observed, assuming that the null hypothesis is correct.
Interpretation Rule: If P < α, Reject H₀.
Example Sum 2: One-Sample Z-Test
Claim: Population mean IS 100. Sample: n=36, x̄=104, σ=12. Test at α=0.05.
Hypothesis: H₀: μ = 100 vs H₁: μ ≠ 100 (Two-tailed)
Test Statistic Z = (x̄ - μ) / (σ/√n) = (104 - 100) / (12/6) = 4 / 2 = 2.0
Critical Value: For α=0.05 (two-tailed), Z_crit = ±1.96
Conclusion: Since Z (2.0) > 1.96, we Reject H₀. The mean is significantly different from 100.
Module 4 Summary
Statistical inference bridges the gap between sample data and population truth via Estimation and Hypothesis Testing.
- statistical-inference
- hypothesis-testing
- confidence-interval
- data-analysis
- statistics-tutorial
- z-test
- null-hypothesis