
Future Data Center Strategy & Market Forces (2025-2029)
Explore the 5 structural forces reshaping global data centers: AI workloads, APAC growth, hyperscaler dominance, and new power-constrained colocation models.
Global Data Center Strategy
5 Structural Forces (2025–2029)
<ul><li><strong>Demand Concentration:</strong> Shifting heavily to hyperscalers and AI workloads.</li><li><strong>Geography Rebalancing:</strong> APAC now leads global site growth.</li><li><strong>Economic Bifurcation:</strong> Split between traditional colo and AI-native infrastructure.</li></ul>
<ol><li>Hyperscalers</li><li>Colocation & Wholesale Platforms</li><li>Regional / APAC Champions</li><li>AI-Centric Operators</li><li>Singapore–Johor–Batam Corridor Model</li></ol>
Scale, power access, and geography now matter more than asset count.
The Market Has Entered a Structural Shift
<h3>Three Irreversible Trends</h3><ul><li><strong>Hyperscalers & AI:</strong> Now drive the majority of new global capacity.</li><li><strong>APAC Dominance:</strong> Surpassed North America in new site growth.</li><li><strong>Diverging Returns:</strong> Split between stable-yield assets and AI infrastructure.</li></ul><h3>What This Means</h3><p>Historical growth assumptions no longer predict future winners. Portfolio strategy must change, not just allocation.</p>
The 5 Structural Forces Shaping the Market
<ul style='list-style:none; padding:0;'> <li style='margin-bottom:20px;'><strong style='color:#003366;'>1. Hyperscalers:</strong> Control demand, standards, and pricing.</li> <li style='margin-bottom:20px;'><strong style='color:#003366;'>2. Colocation Platforms:</strong> Scale under power constraints.</li> <li style='margin-bottom:20px;'><strong style='color:#003366;'>3. APAC Champions:</strong> Win via regulation and execution.</li> <li style='margin-bottom:20px;'><strong style='color:#003366;'>4. AI-Centric Operators:</strong> High-risk, high-density asset class.</li> <li style='margin-bottom:20px;'><strong style='color:#003366;'>5. Corridor Models:</strong> Control separated from capacity.</li> </ul>
Each force implies a different capital model, risk profile, and governance approach.
Force #1: Hyperscalers
<h3>Market Position</h3><ul><li>~41% of global capacity today.</li><li>Projected to exceed 60% by 2029.</li></ul><h3>Structural Advantages</h3><ul><li>Control technical standards & design.</li><li>Long-term take-or-pay contracts offer visibility.</li><li>Shift power and grid risk downstream.</li></ul><p style='margin-top:20px; font-weight:bold; color:#0055aa;'>Implication: Alignment with hyperscaler roadmaps is now a prerequisite.</p>
Force #2: Colocation & Wholesale Platforms
<h3>Current Role</h3><ul><li>~33% of global data center revenue.</li><li>11–14% CAGR, driven by cloud adjacency.</li></ul><h3>Structural Challenges</h3><ul><li>Capital intensive with declining marginal returns.</li><li><strong>Power access</strong> is now the binding constraint.</li></ul>
<strong>Bifurcation Risk:</strong> Market splitting between Interconnect-rich metros vs. Hyperscale campuses. Sub-scale platforms face margin compression.
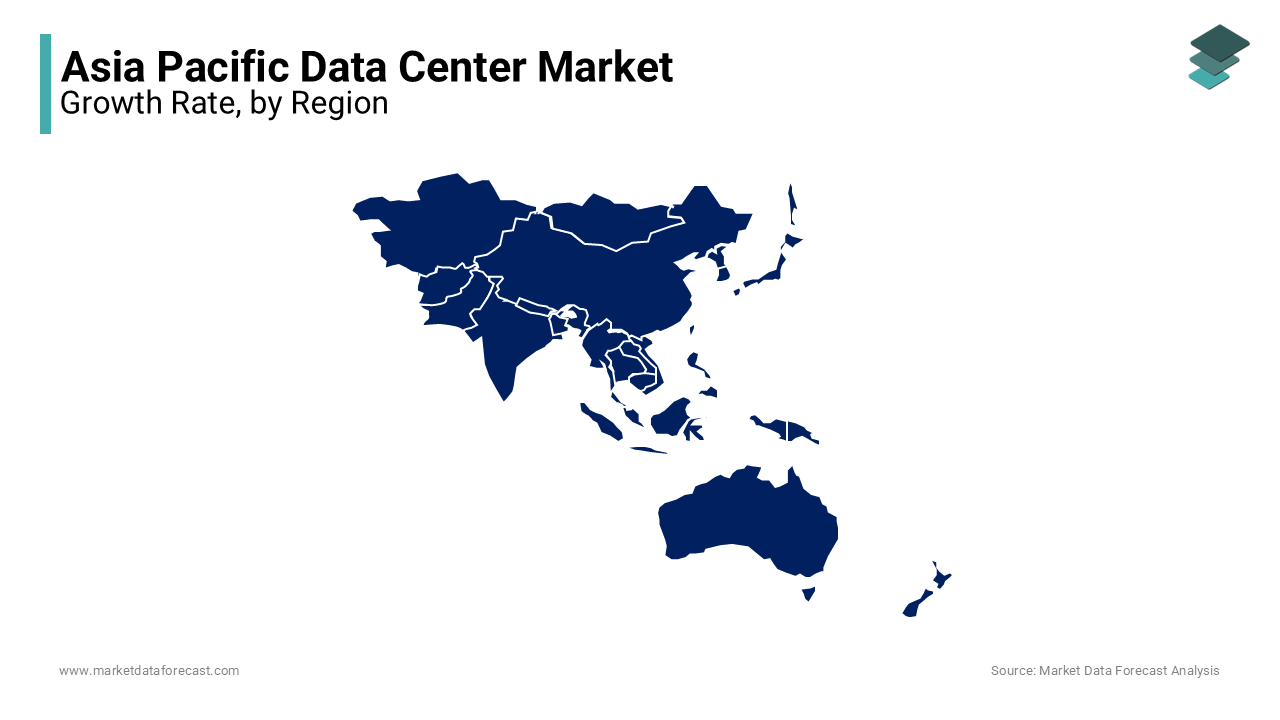
Force #3: Regional / APAC Champions
<h3>Why APAC Leads</h3><ul><li>APAC site count > North America (1970 vs 1427).</li><li>Driven by Sovereign Cloud & Data Residency.</li><li>AI inference latency requirements favoring local.</li></ul>
<h3>Competitive Advantage</h3><ul><li>Local regulatory knowledge.</li><li>Faster execution and permitting.</li><li>Political and utility alignment.</li></ul>
Force #4: AI-Centric Operators
<table style='width:100%; border-collapse:collapse; font-size:22px; margin-bottom:30px;'> <thead> <tr style='background:#003366; color:white; text-align:left;'> <th style='padding:15px;'>Metric</th> <th style='padding:15px;'>Traditional Colo</th> <th style='padding:15px;'>AI Infrastructure</th> </tr> </thead> <tbody> <tr style='border-bottom:1px solid #ddd;'> <td style='padding:15px; font-weight:bold;'>Rack Density</td> <td style='padding:15px;'>5–15 kW</td> <td style='padding:15px; color:#D00;'>30–100+ kW</td> </tr> <tr style='border-bottom:1px solid #ddd;'> <td style='padding:15px; font-weight:bold;'>Primary Constraint</td> <td style='padding:15px;'>Land & Fiber</td> <td style='padding:15px;'>Power & Cooling</td> </tr> <tr style='border-bottom:1px solid #ddd;'> <td style='padding:15px; font-weight:bold;'>Contract Duration</td> <td style='padding:15px;'>5–10 Years</td> <td style='padding:15px;'>2–5 Years</td> </tr> </tbody> </table>
<h3>Risk / Return Profile</h3><p>Higher volatility, utilization risk, and hybrid returns.</p><h3>Key Implication</h3><p>AI infrastructure cannot be valued, financed, or governed like traditional data centers.</p>
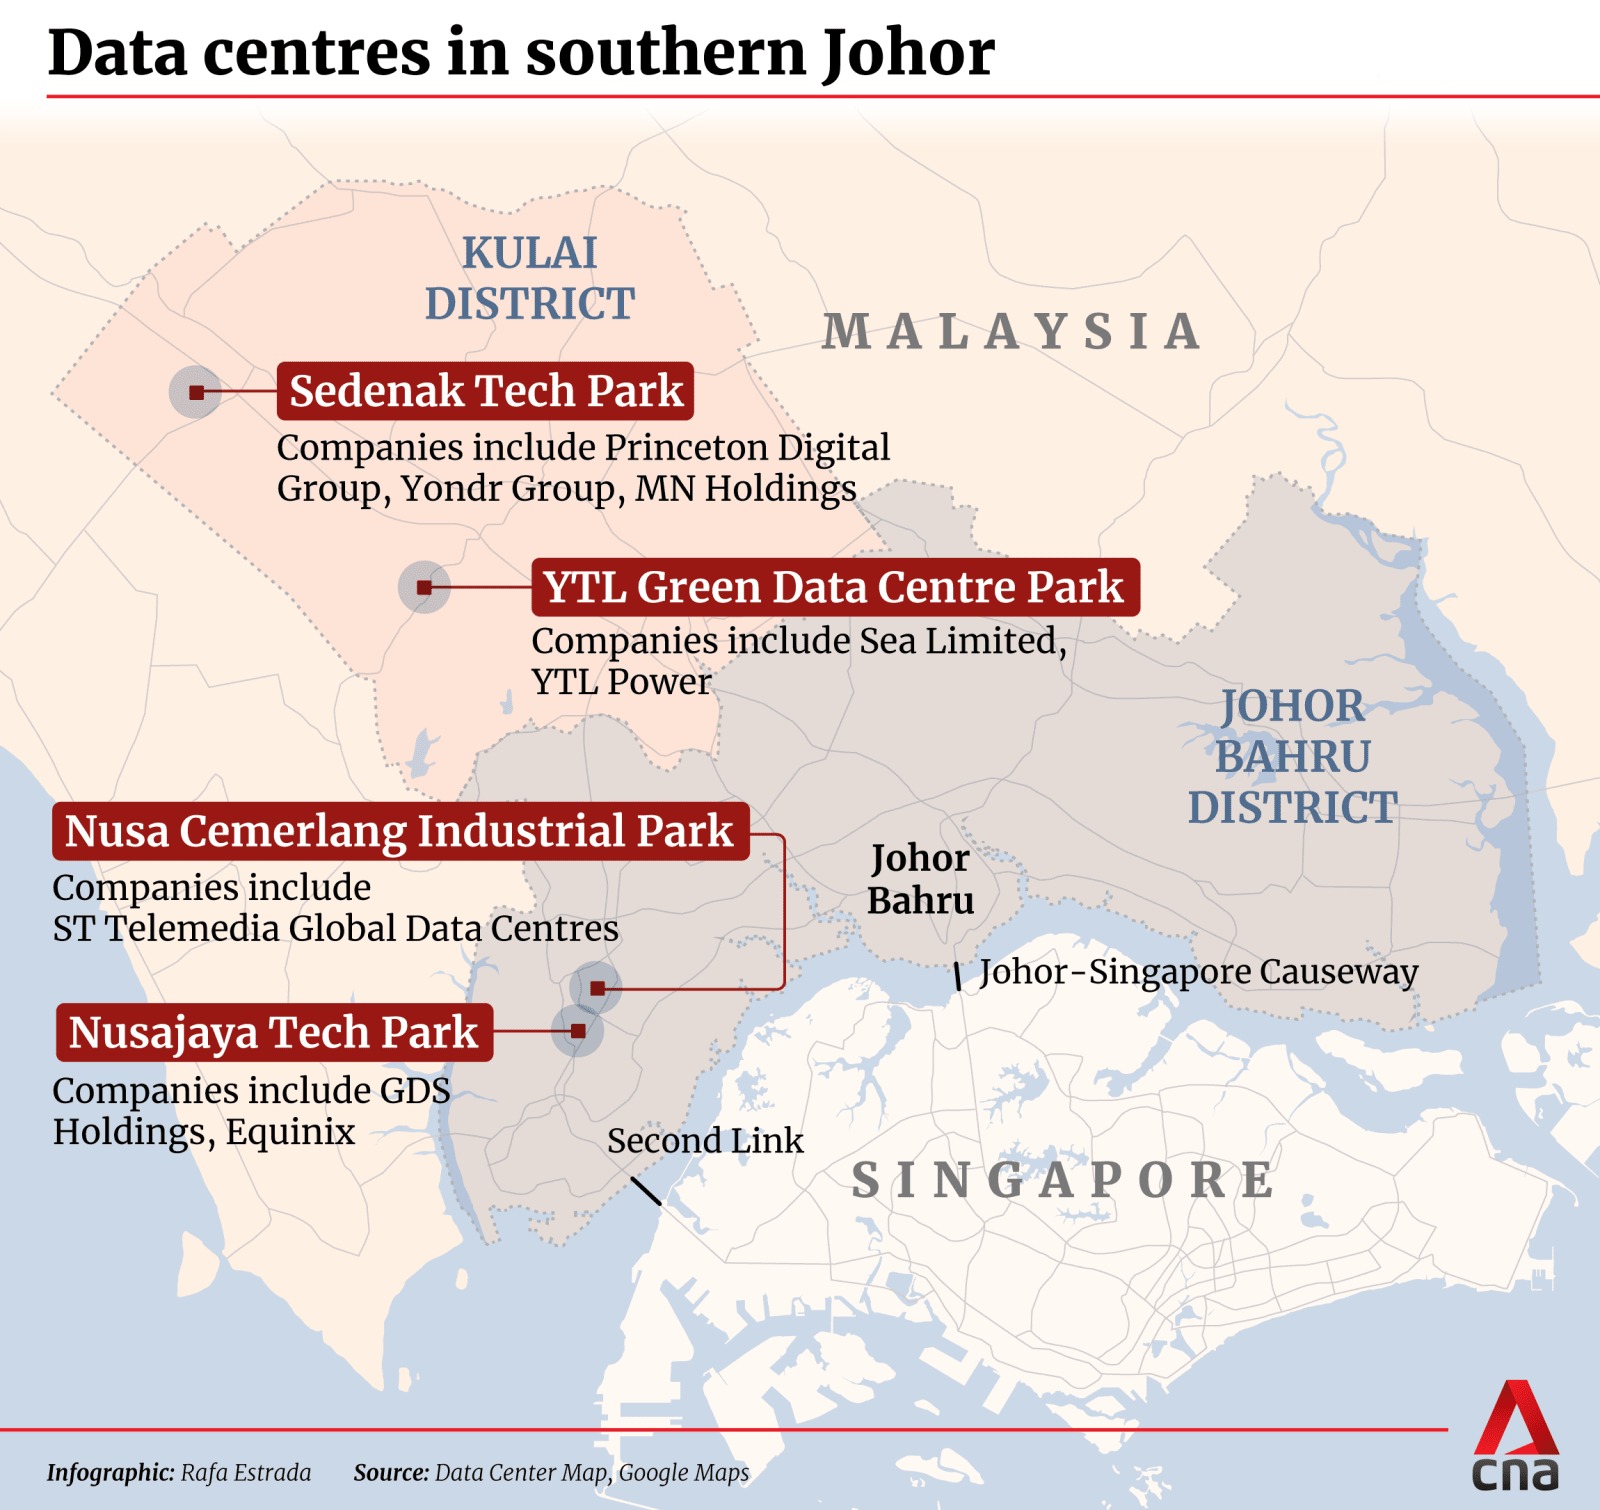
Force #5: Singapore–Johor–Batam Corridor
<div style='margin-bottom:20px;'><strong>Singapore (Control Plane):</strong> HQ, cloud regions, legal/financial hub. Constrained land/power.</div><div style='margin-bottom:20px;'><strong>Johor / Batam (Capacity Plane):</strong> Lower-cost land/power. Multi-GW campuses. Sub-20ms latency.</div><div style='margin-top:20px; color:#003366; font-weight:bold;'>Why It Matters: Separates control from capacity. Replicable model for FLAP-D and other major hubs.</div>
Competitive Outlook: Winners vs Losers
<h2 style='color:#2E7D32;'>Likely Winners</h2><ul style='list-style-type: cjk-ideographic;'><li>Operators with secured <strong>long-term power</strong>.</li><li>Platforms aligned with <strong>hyperscaler</strong> expansion.</li><li>Regionally embedded <strong>APAC players</strong>.</li></ul>
<h2 style='color:#C62828;'>Likely Losers</h2><ul style='list-style-type: square;'><li>Sub-scale, single-country operators.</li><li>Balance-sheet–constrained developers.</li><li>Assets exposed to power curtailment or policy shifts.</li></ul>
Board-Level Implications
<h3>What Now Drives Advantage</h3><ul><li><strong>Scale & Power:</strong> Now decisive factors.</li><li><strong>Returns:</strong> Increasingly geography- and policy-driven.</li><li><strong>AI Infrastructure:</strong> Requires separate underwriting.</li></ul><h3>Governance Reality</h3><p>One portfolio can no longer operate under one risk model.</p>
Strategic Options (Decision Frame)
<div style='display:grid; grid-template-columns: 1fr 1fr; gap:30px; height:100%;'><div style='background:white; padding:25px; border:1px solid #ddd;'> <h3 style='color:#003366;'>1. Double Down on Scale</h3> <p>Hyperscale / Wholesale alignment.</p></div><div style='background:white; padding:25px; border:1px solid #ddd;'> <h3 style='color:#003366;'>2. Regional Champion</h3> <p>APAC-led growth strategy.</p></div><div style='background:white; padding:25px; border:1px solid #ddd;'> <h3 style='color:#003366;'>3. AI-Native Platform</h3> <p>Higher risk, higher upside.</p></div><div style='background:white; padding:25px; border:1px solid #ddd;'> <h3 style='color:#003366;'>4. Corridor Arbitrage</h3> <p>Separating control from capacity.</p></div></div>
Each option implies a different capital structure, risk tolerance, and governance requirement.
The Strategic Question for the Board
Where do we have an unfair advantage — <br><span style='color:#00AADD;'>capital, power, partnerships, or geography</span> — <br>and which force do we deliberately align with?
Decision Horizon: Choices made in the next 12–24 months determine relevance through 2030.
- data-center-strategy
- ai-infrastructure
- hyperscale
- apac-market
- colocation
- digital-infrastructure
- market-analysis