
Math Meets Music: Learning Statistics Through Hip-Hop
Explore math, statistics, and patterns using data from J. Cole, Kendrick Lamar, and Lil Wayne. Learn mean, median, mode, and rhythmic fractions.
Math Meets Music
Exploring Statistics & Patterns Through Hip-Hop
Data, Patterns & the Science of Hip-Hop
What is Math in Music?
Hip-hop artists like J. Cole, Kendrick Lamar & Lil Wayne give us real-world math to explore.
Rhythm & Counting
Beats are divided into fractions of time.
Statistics
We can analyze chart performance and streaming data.
Patterns & Sequences
Musical structures follow mathematical patterns.
Data Analysis
Album sales, rankings, and comparisons use real math.
Meet the Artists
Three legends. Decades of data.
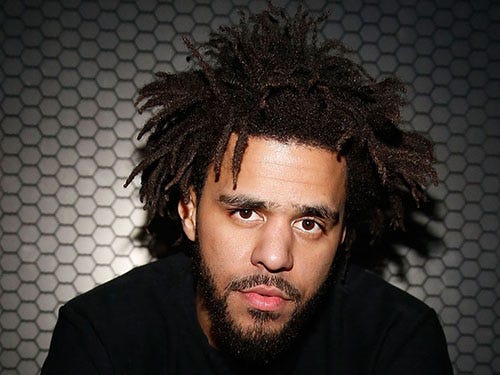
J. Cole
Jermaine Lamarr Cole
1985
Fayetteville, NC
2011
6 consecutive #1 multi-platinum studio albums
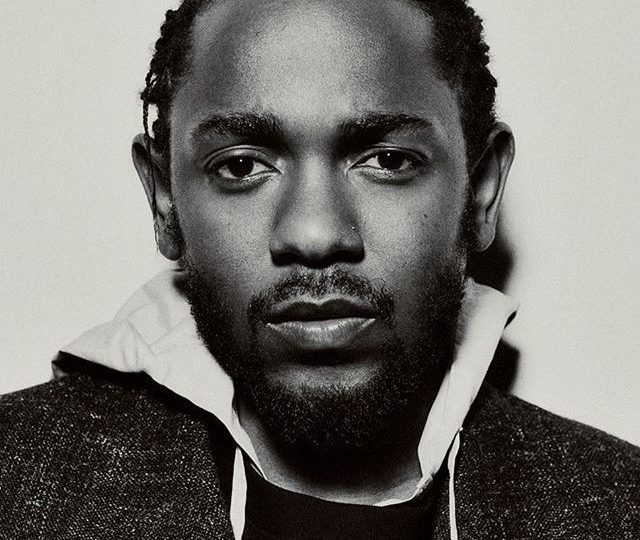
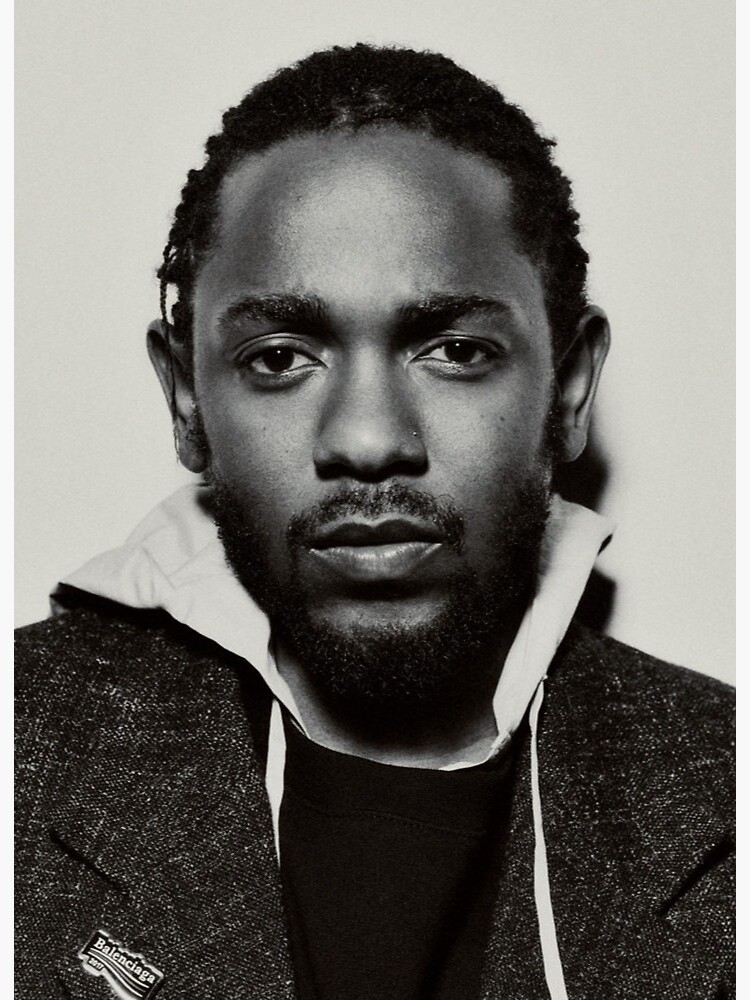
Kendrick Lamar
Kendrick Lamar Duckworth
1987
Compton, CA
2011
17 Grammy Awards across 4 decades
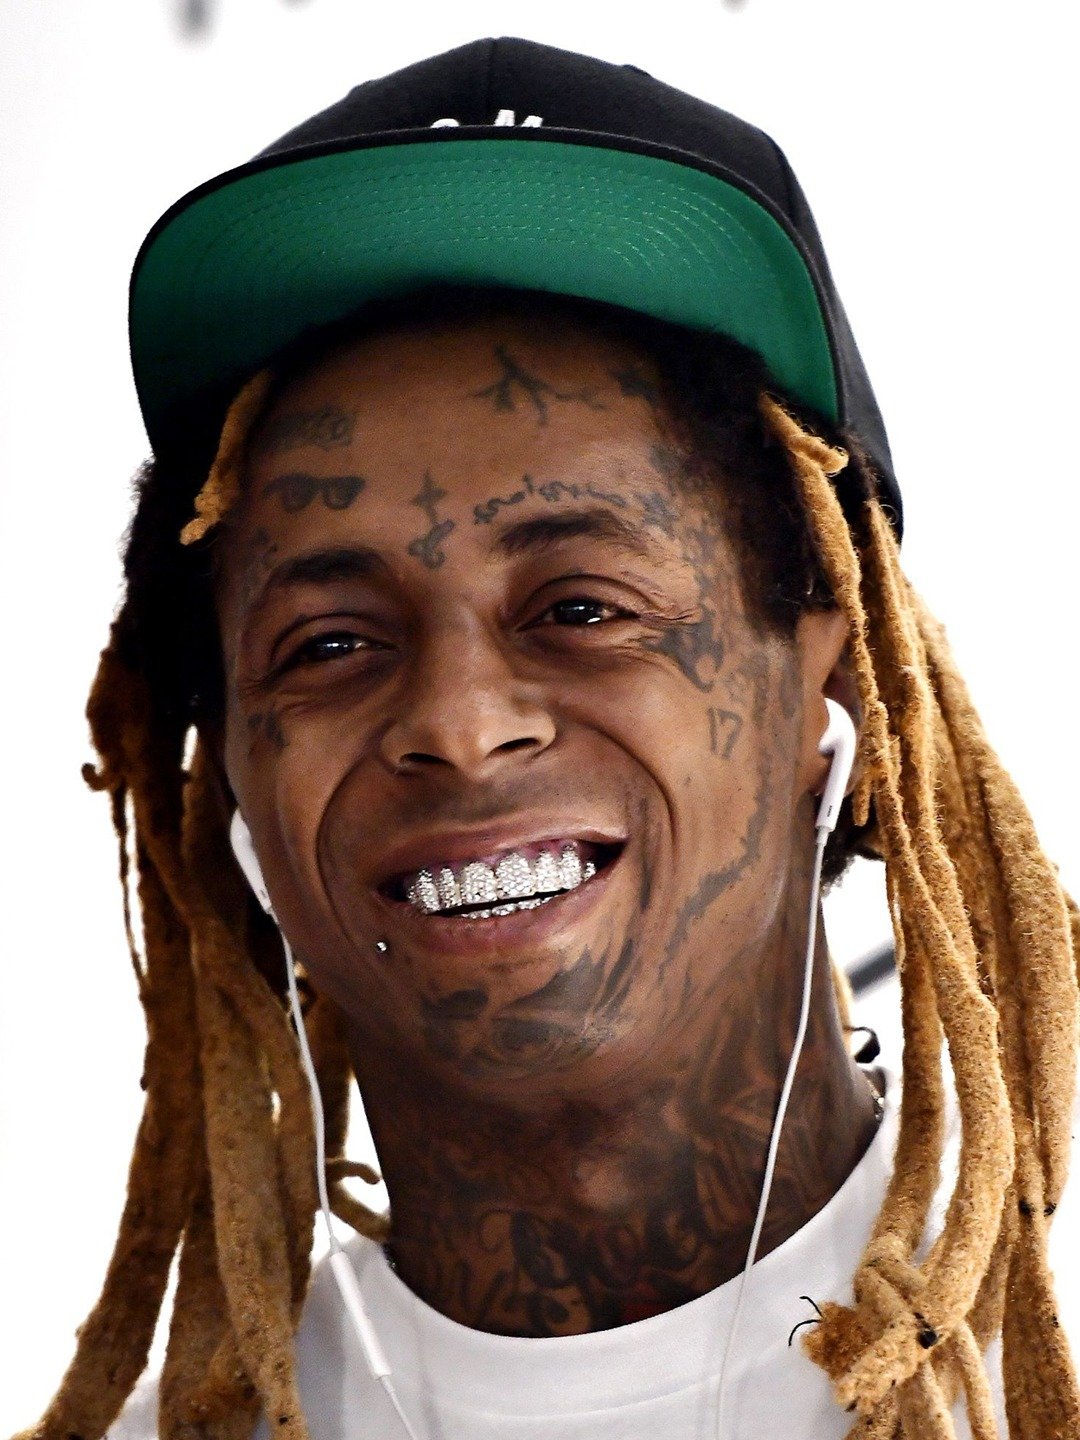
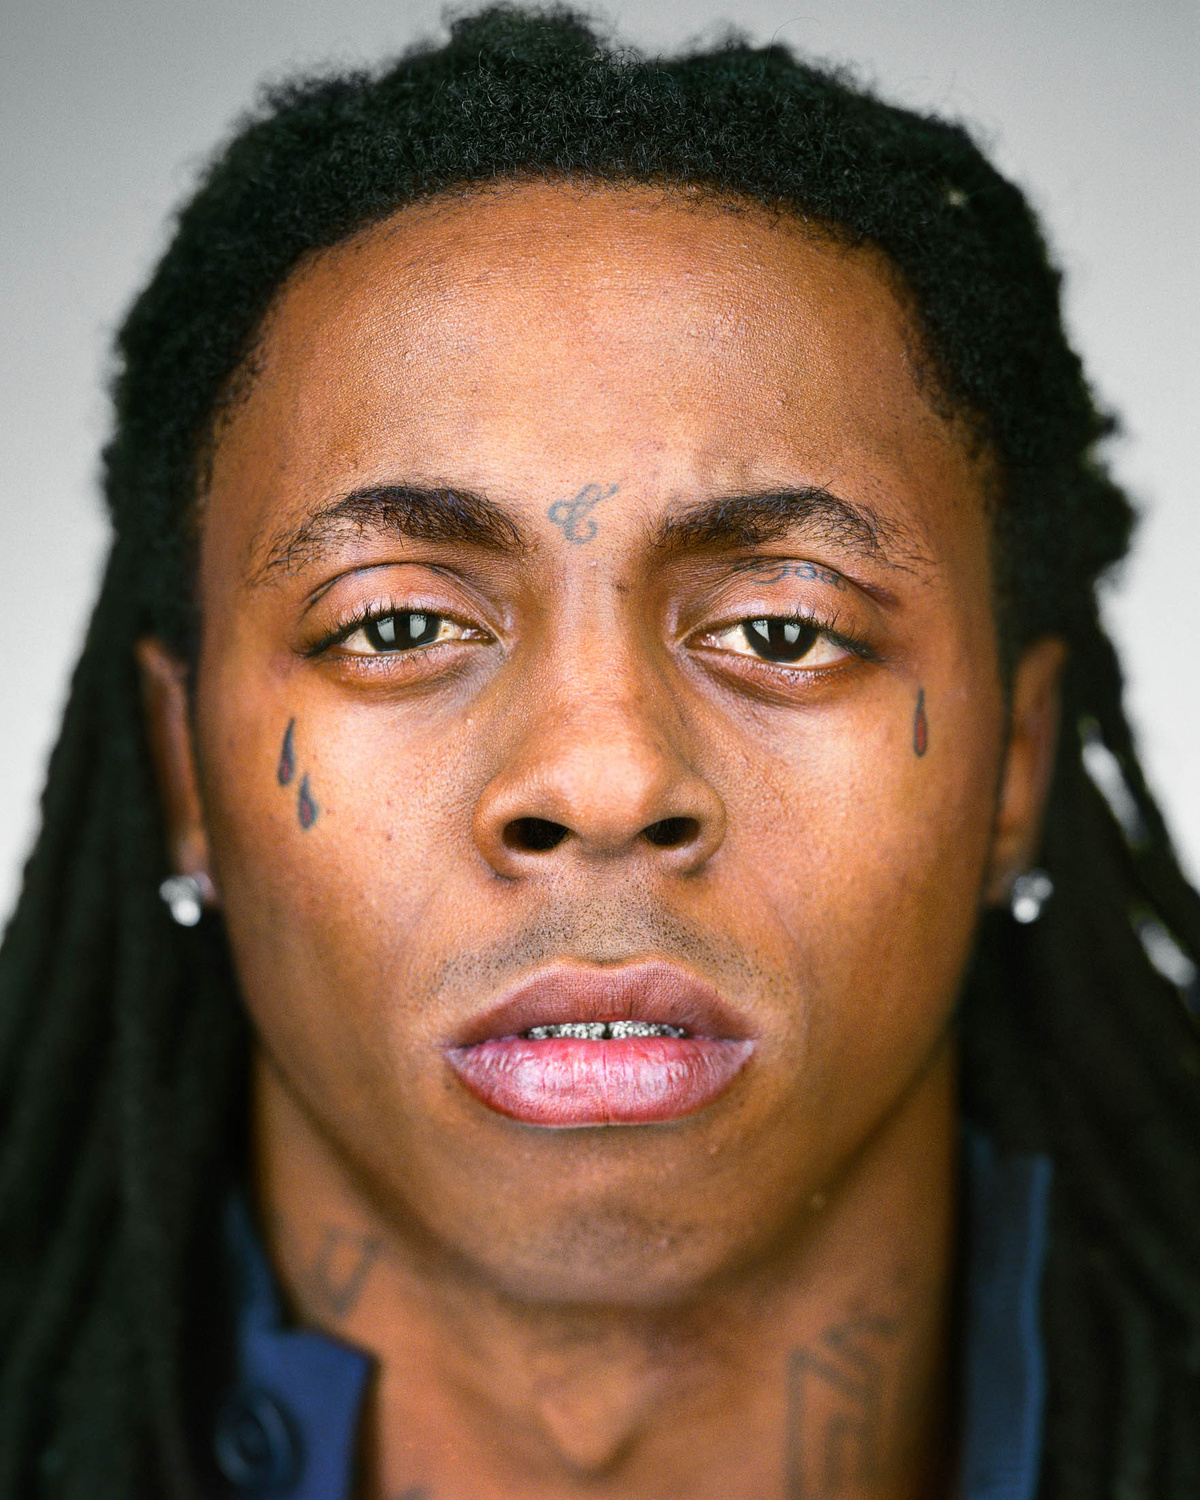
Lil Wayne
Dwayne Michael Carter Jr.
1982
New Orleans, LA
1999
183 appearances on the Billboard Hot 100 chart
Album Sales: Reading the Numbers
First-Week Album Sales — Debut Albums
How many MORE albums did Lil Wayne sell than J. Cole in week 1?
What is the MEAN of these three debut sales numbers?
Express J. Cole's sales as a fraction of Lil Wayne's.
Spotify Streams: Working with Large Numbers
~28M
~40M
46.9M
Round each number to the nearest million.
Who has the most listeners? By how many million more than the lowest?
What is the total combined monthly listenership?
Patterns in Discography: Number Sequences
A mathematical analysis of album release timelines
J. Cole
Kendrick Lamar
Lil Wayne
What patterns do you notice?
Can you predict when the next album might drop?
Mean, Median & Mode: Chart Positions
Song
Artist
Peak
"Lollipop"
Lil Wayne
#1
"A Milli"
Lil Wayne
#6
"Mr. Carter"
Lil Wayne
#4
"HUMBLE."
Kendrick Lamar
#2
"DNA."
Kendrick Lamar
#4
"All My Life"
J. Cole
#3
"No Role Modelz"
J. Cole
#15
Step-by-Step Example
Ordered List:
1, 2, 3, 4, 4, 6, 15
Mean
(1+2+3+4+4+6+15) ÷ 7 =
5
Median
(middle value)
4
Mode
(appears most often)
4
Try It!
Remove 'No Role Modelz' (#15). How do the mean, median, and mode change?
Graphing It Out: Data Visualization
Comparing Artists by the Numbers
Which artist has the most studio albums? How many more than J. Cole?
What percentage of the combined Grammy wins does Kendrick Lamar hold?
Create your own bar graph using this data in your notebook.
Fractions & Beats
The Math of Rhythm
Most hip-hop songs, including those by J. Cole, Kendrick Lamar, and Lil Wayne, use 4/4 time — meaning <b>4 quarter-note beats</b> per measure.
If a song has 32 bars and each bar has 4 beats, how many total beats are in the song?
If Lil Wayne raps 6 syllables per beat, how many syllables in 32 bars?
Class Activity: Be a Data Analyst!
Work in groups and present your findings to the class.
📊 The Stats Battle
Compare J. Cole, Kendrick Lamar, and Lil Wayne using the data from this presentation. Create a table with at least 3 statistics for each artist. Who "wins" each category?
📈 Graph It!
Using the album sales data, draw your own bar graph on graph paper. Make sure to label the axes, title, and scale.
🎵 Pattern Predictor
Look at each artist's album release years. Find the average gap between albums. Based on the pattern, predict when each artist might release their next album. Show your math!
Math is everywhere — even in your playlist. 🎧
What Did We Learn?
Math is the language of music
Reading and comparing large numbers
(album sales & streams)
Calculating Mean, Median & Mode
(chart positions)
Identifying patterns in number sequences
(album release years)
Understanding fractions in music
(beats & time signatures)
Creating and interpreting bar graphs
(artist comparisons)
Percentages and ratios
(Grammy wins, sales fractions)
Keep exploring math in everything around you!
- math-education
- statistics
- hip-hop-data
- data-analysis
- middle-school-math
- music-theory