


Airlines Flight Operations: low-cost vs Full-Service Models
Explore flight operations structures and interdepartmental synergy. A case study comparison between easyJet and British Airways performance models.
INDIVIDUAL ASSIGNMENT
Introduction to Flight Operations
Flight Operations Structures, Interdepartmental Relationships & Operational Performance
Samir Shaon & Flynn McCarthy-Wallace
Introduction to Flight Operations
AGENDA
Contents
Overview of Flight Operations structure, comparative operating models, interdepartmental synergy, and impact on performance outcomes.
Introduction
The role of the Flight Operations Department
Flight Operations Structures
Low-Cost vs Full-Service Airlines
easyJet vs British Airways
A Structural Comparison
Interdepartmental Relationships
British Airways in Focus
Impact on Operational Performance & Conclusion
Final overviews and closing remarks
Introduction
The Flight Operations Department is a fundamental workstream inside any airline
Responsible for safety and efficiency of all flight activities
Operational focus differs based on the airline's business model
Full-service carriers require complex organisational structures
Low-cost carriers prioritise efficiency and cost control
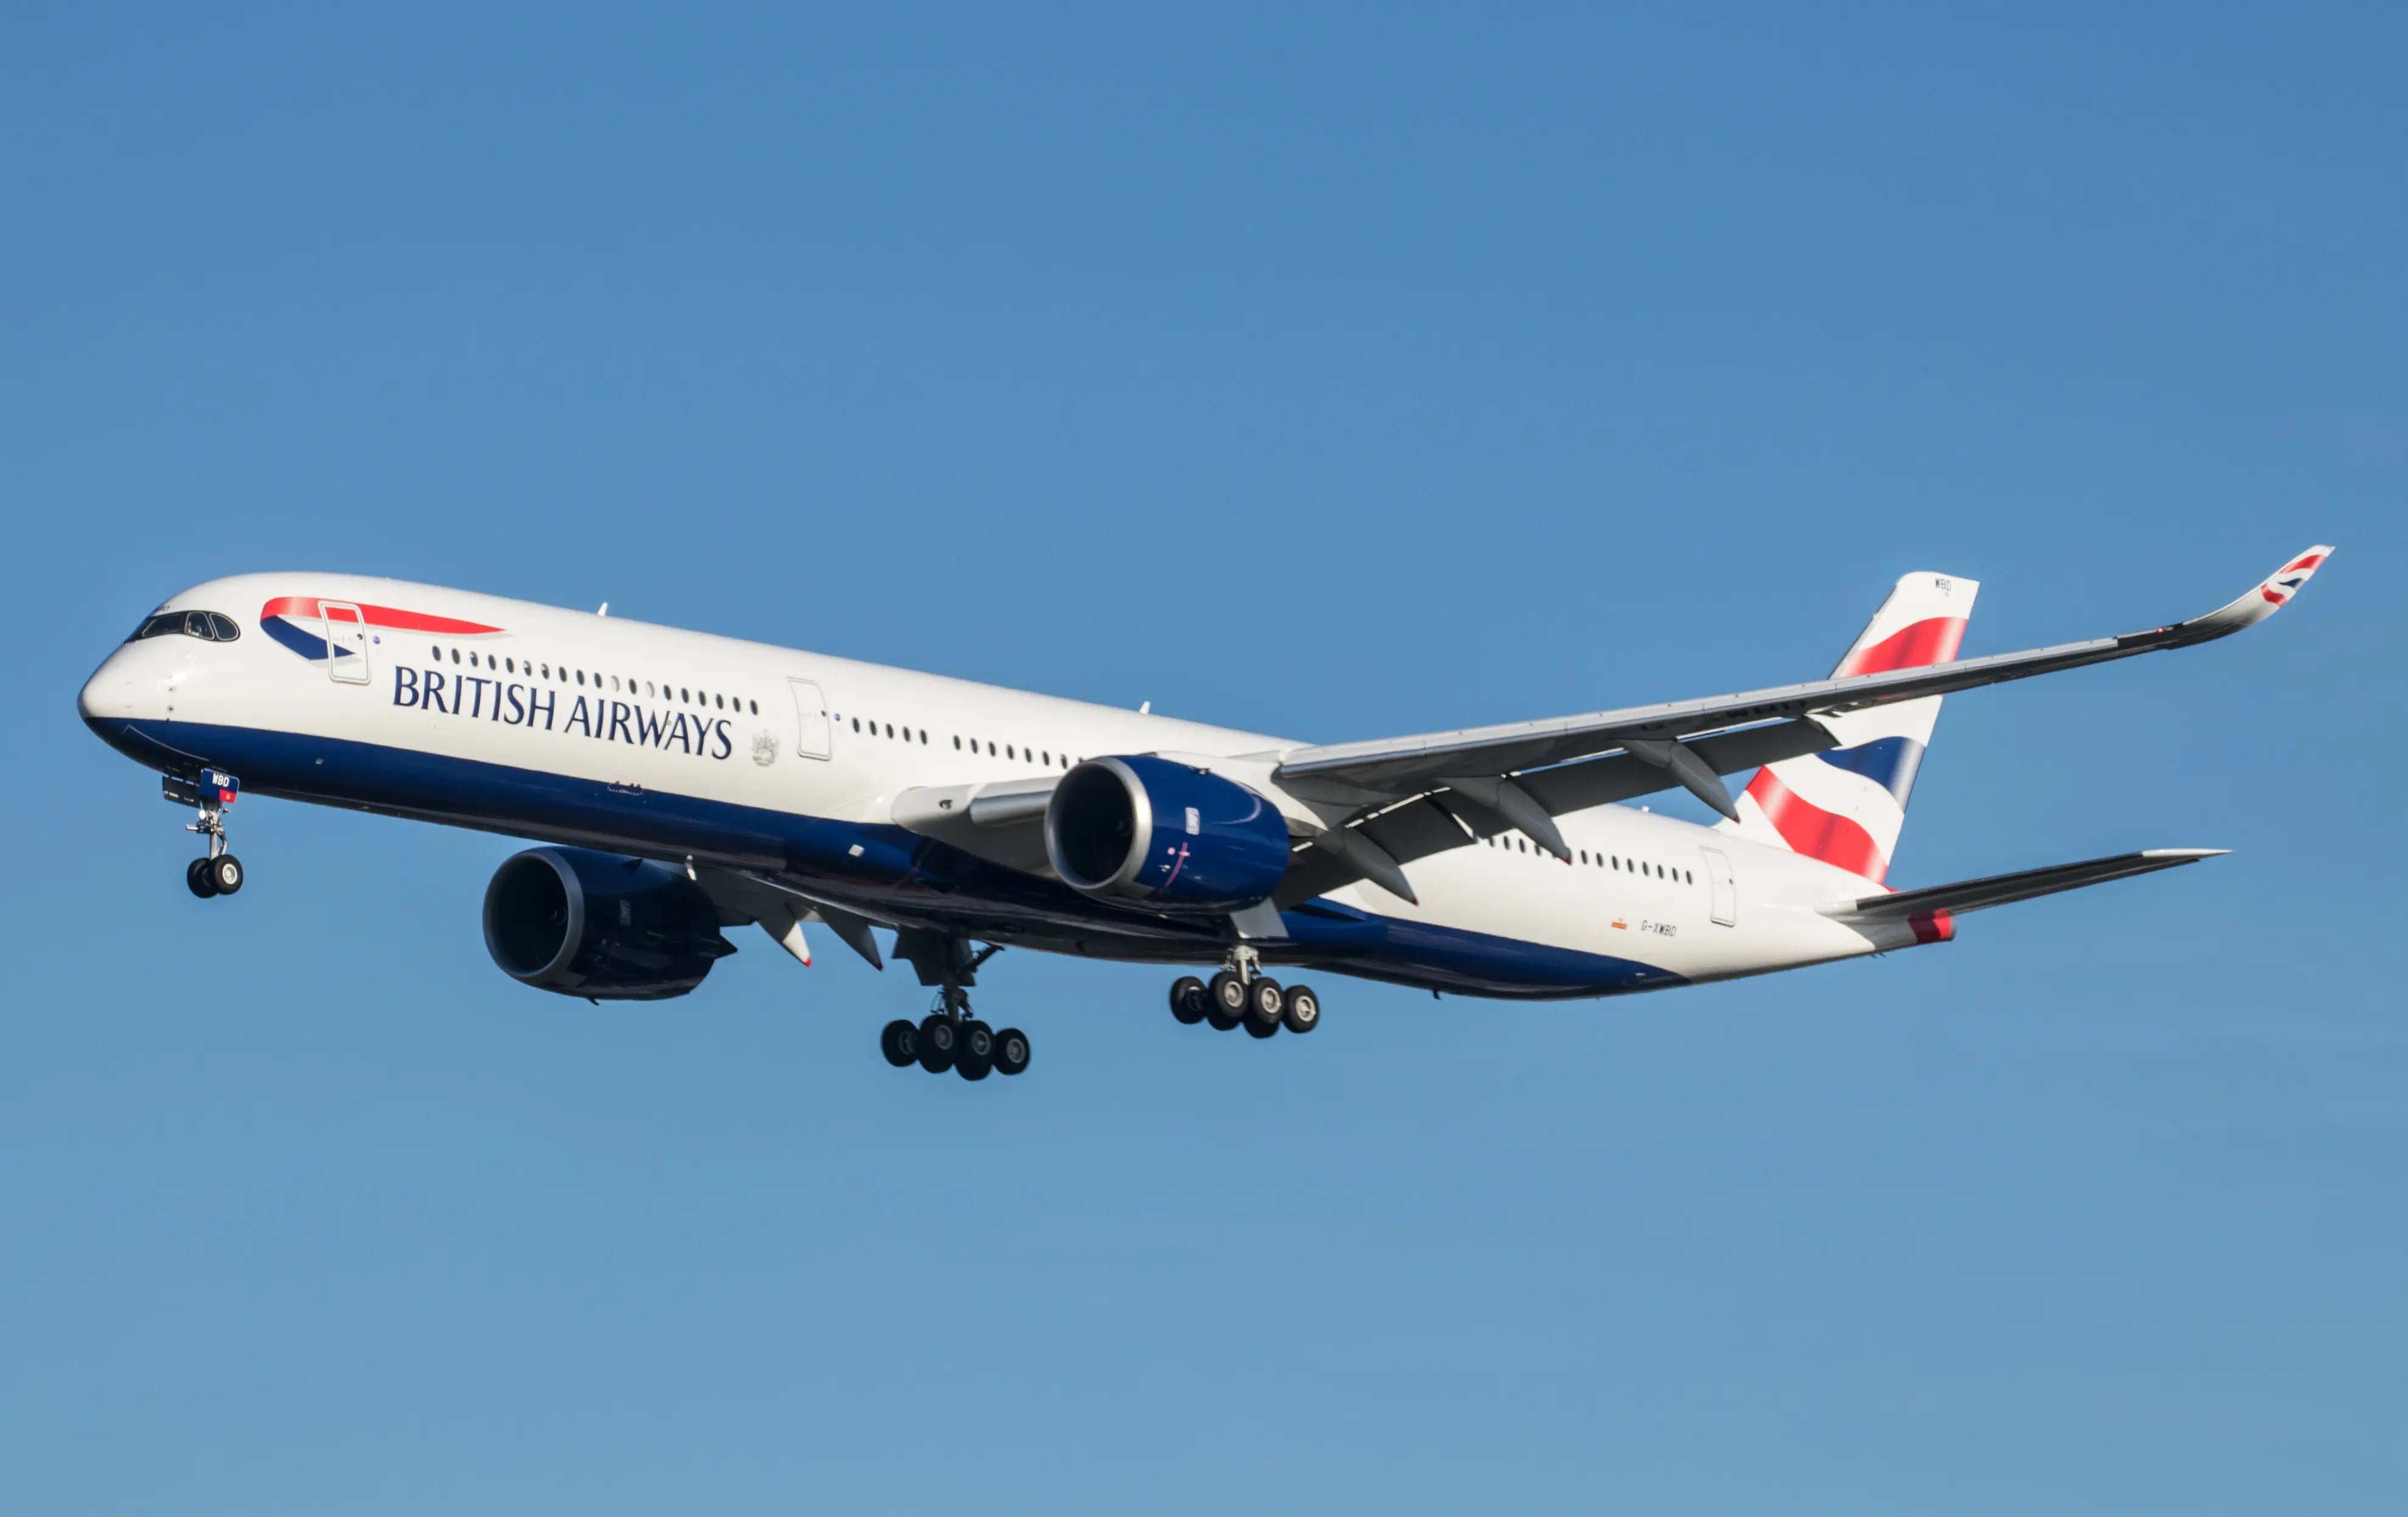
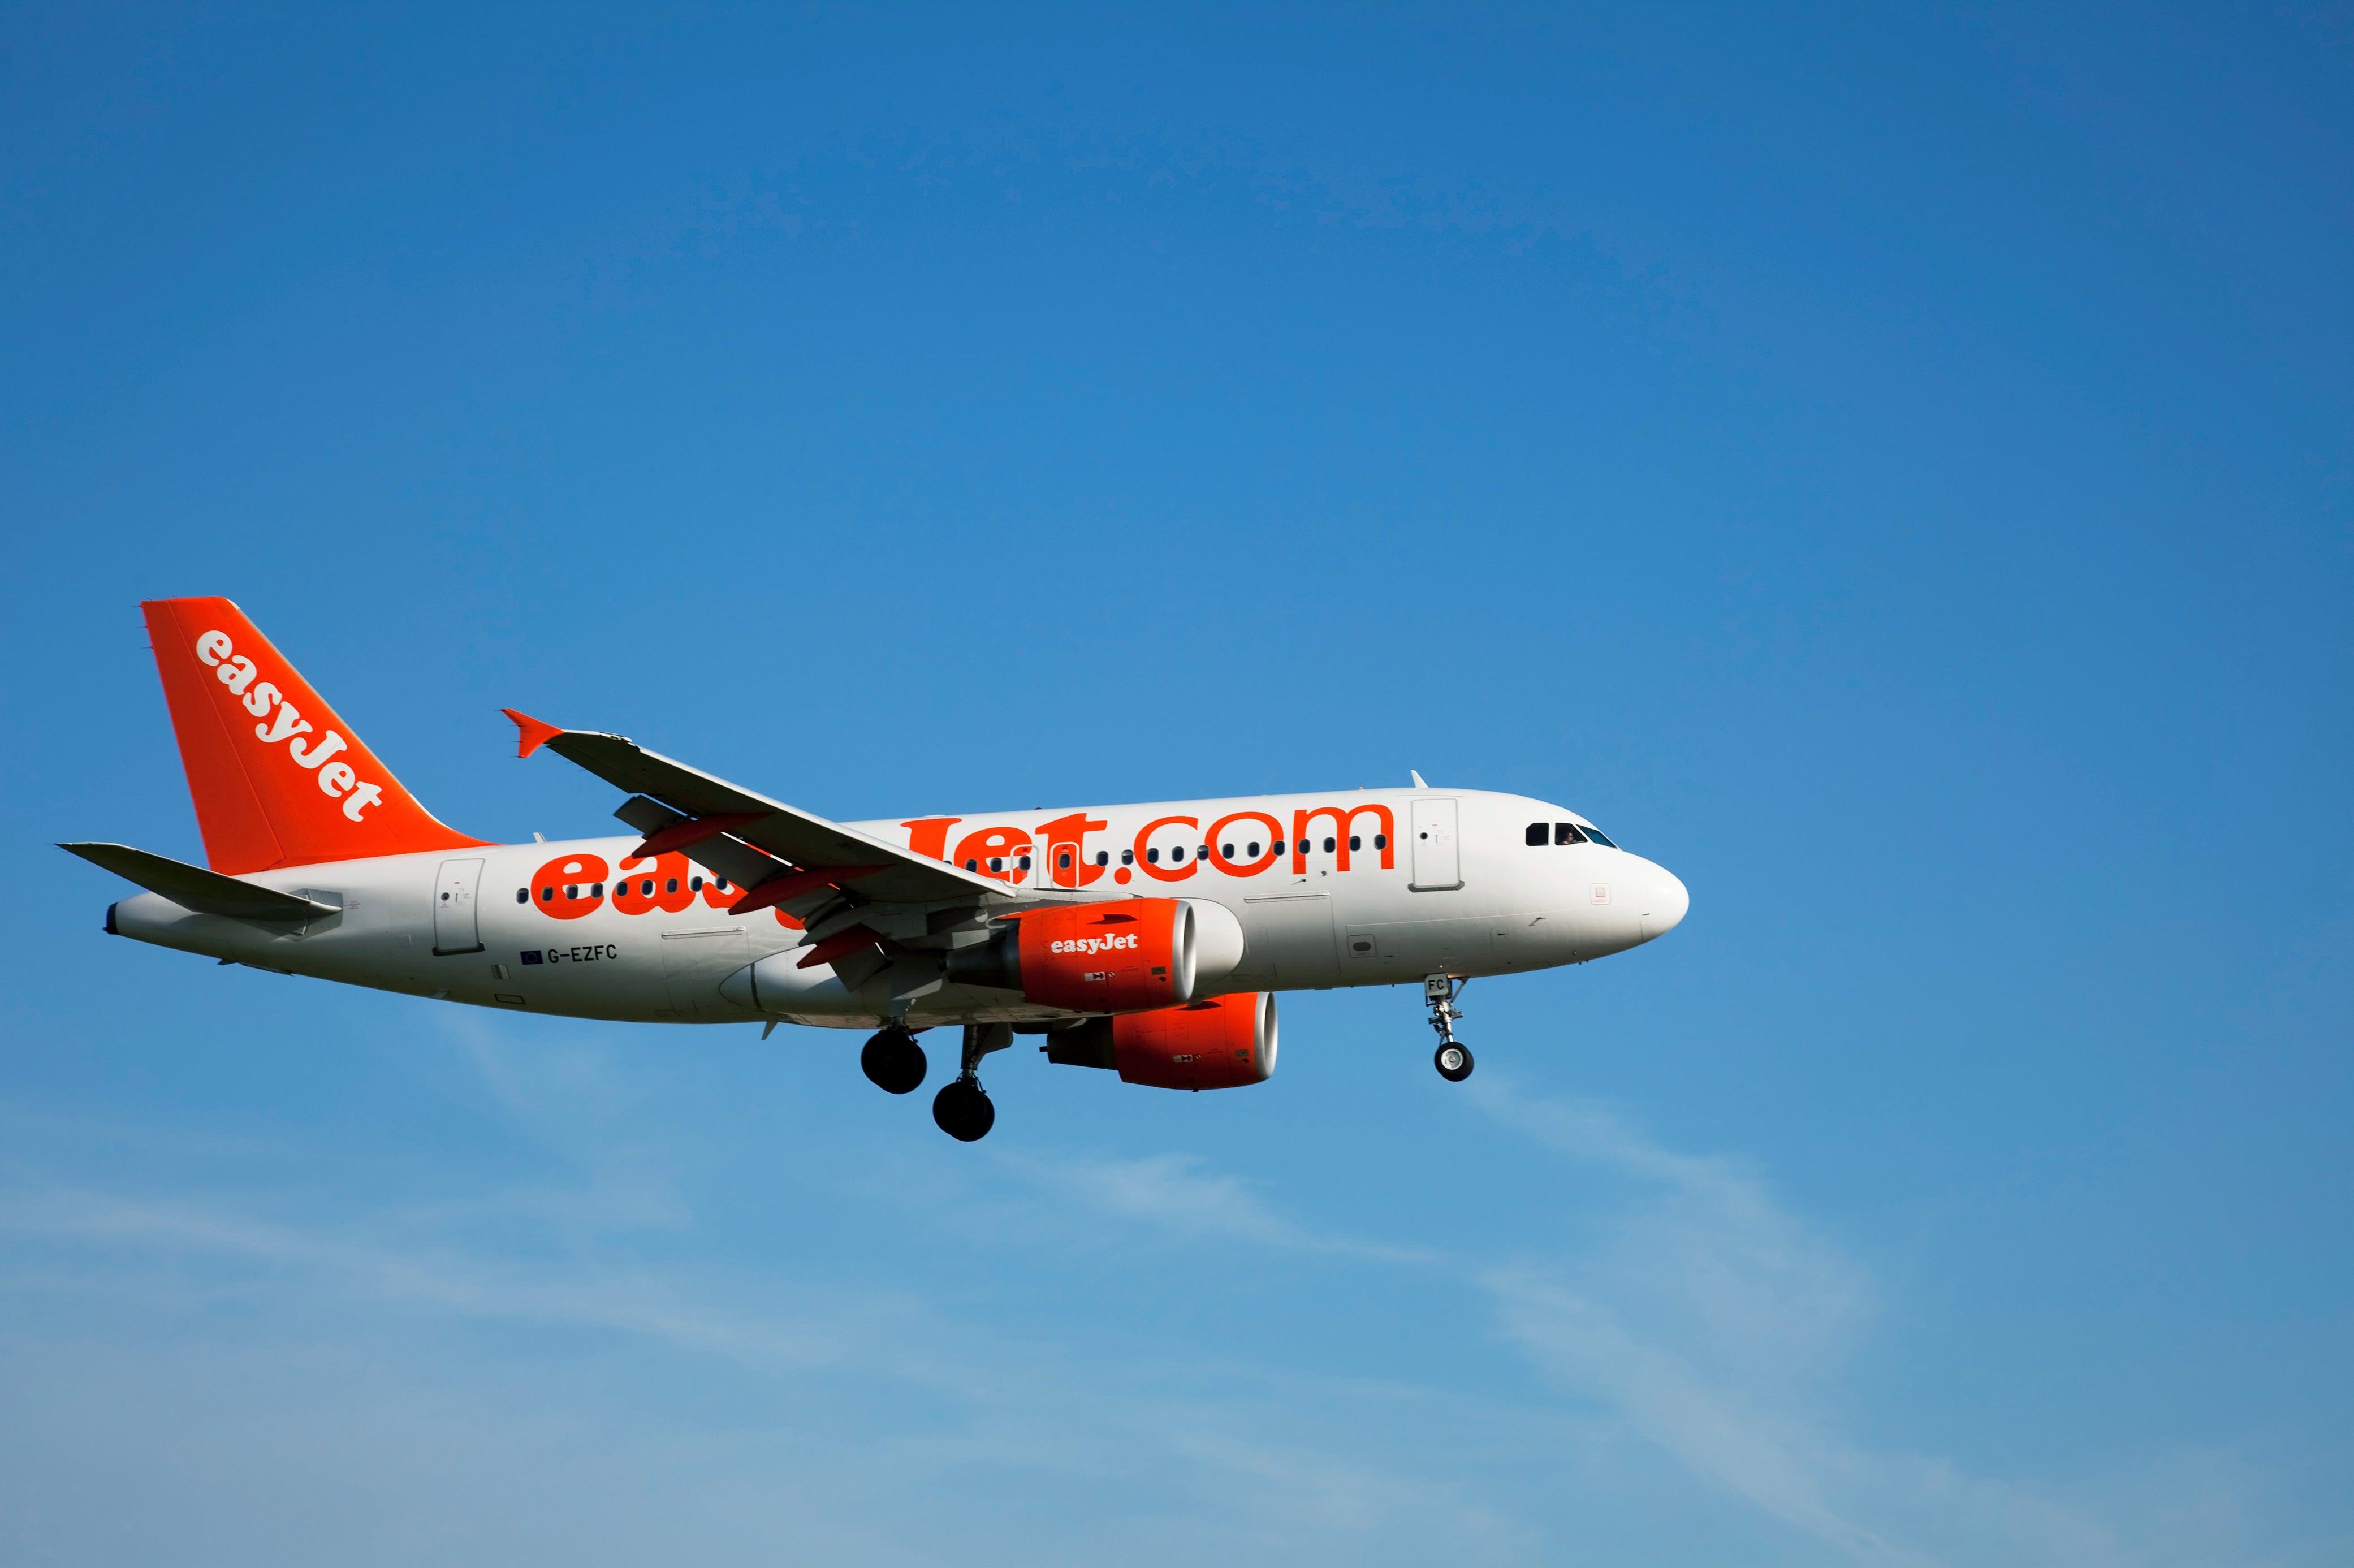
This report uses British Airways and easyJet as case studies
Applies academic theory from Meijer (2020) and Airline Operations Control (2020)
Sources: Meijer (2020); Airline Operations Control (2020)
Flight Operations Structures
Low-Cost Carriers vs Full-Service Carriers
A Tale of Two Airlines
Structural Philosophy in Action
LOW-COST CARRIER
Single aircraft type: Airbus A320 family
Centralised ops model
Low overhead structure
High aircraft utilisation
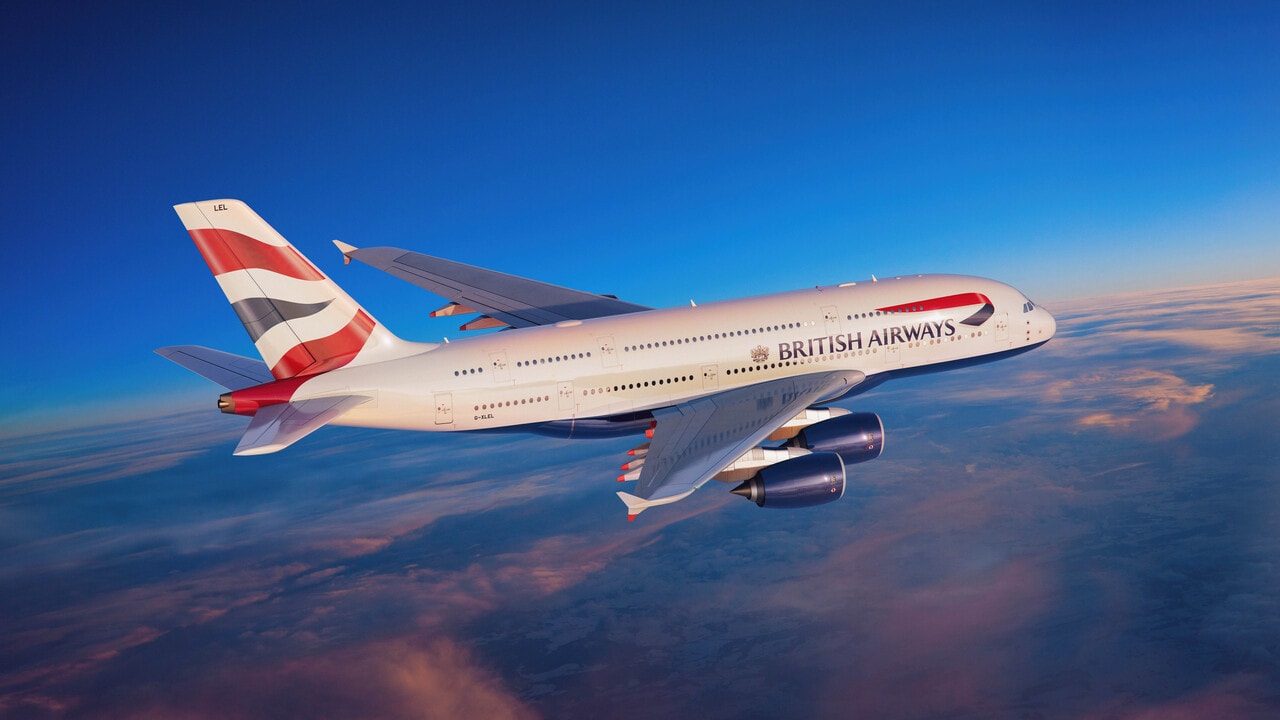
FULL-SERVICE CARRIER
Mixed fleet: B787, B777, A380, A320
Specialised departmental units
Operational Control Centre
Long-haul & short-haul network
"The key structural difference lies in how each airline manages operational complexity." — Meijer (2020, p. 55)
Interdepartmental Relationships
British Airways — Flight Operations as the Hub
FLIGHT OPERATIONS
MAINTENANCE DEPARTMENT
Aircraft availability affects schedules & crew planning
Maintenance data used for rotation planning
Joint disruption response
Source: Airline Operations Control (2020, p. 92)
FINANCE DEPARTMENT
Route planning & fuel management cost alignment
Budget management & delay impact assessment
Operational efficiency supports airline strategy
Source: Meijer (2020, p. 67)
SAFETY & COMPLIANCE DEPARTMENT
Shares incident reports & performance data
Feeds Safety Management System (SMS)
Ensures regulatory compliance across all operations
Source: Airline Operations Control (2020, p. 102)
Impact on Operational Performance
easyJet
STRENGTH: Cost Efficiency
British Airways
STRENGTH: Resilience & Flexibility
RISK MATRIX ANALYSIS
Foreign Object Debris (FOD)
Qualitative Risk Matrix Comparison — Flynn vs Samir
The Same Hazard — Different Exposure
Both Flynn and Samir face the identical FOD hazard on the runway. The critical differentiator is their level of operational exposure, which directly affects the probability of occurrence.
Why FOD Matters at V1
FOD impact during takeoff — especially after V1 speed — can cause engine damage, tyre burst, or structural failure. Severity is always rated Major to Catastrophic regardless of exposure level.
Qualitative Risk Matrix model applied — assessing Severity vs Likelihood for each operator's exposure level.
Risk Matrix Comparison
FLYNN — 20,000 Flights/Year
SAMIR — 160,000 Flights/Year
Same severity, different probability — operational exposure is the key variable that shifts the risk rating.
Bow-Tie Analysis — FOD Hazard
Comparing Flynn and Samir's Threat & Recovery Profiles
THREATS
Improper runway inspection
Human error on runway
Debris from other aircraft
Bad weather conditions
IDENTICAL FOR BOTH
PREVENTIVE CONTROLS
Regular inspections
Staff training
Safety Management System
SAME FOR BOTH
TOP EVENT
FOD DAMAGES AIRCRAFT DURING TAKEOFF
RECOVERY ACTIONS
Declare emergency
Return to airport
Divert to alternate
Emergency landing
SAME FOR BOTH
CONSEQUENCES
Engine malfunction
Tyre damage
Runway excursion
In-flight emergency
IDENTICAL FOR BOTH
KEY DIFFERENCE: Operational Exposure
— Flynn (20,000 flights/yr) tests barriers far less frequently than Samir (160,000 flights/yr), making barrier failure significantly more probable for Samir — hence MEDIUM vs HIGH risk rating.
Conclusion
Flight Operations structures differ fundamentally between LCCs and FSCs
easyJet: centralised, lean model — optimised for cost and efficiency
British Airways: multi-layered, specialised structure — built for complexity and resilience
Within British Airways, Flight Operations acts as an operational hub
Critical links with Maintenance, Finance, and Safety & Compliance
Structural choices directly shape airline performance, efficiency and resilience
No single 'best' model — structure must align with the airline's business model
Structure is not a bureaucratic choice — it is a strategic one.
Meijer, R. (2020). Airline Operations Control. Routledge. | Airline Operations Control (2020). Industry Reference.
Samir Shaon & Flynn McCarthy-Wallace | Introduction to Flight Operations
CONCLUSION
Same Hazard, Different Risk
Flynn and Samir face identical FOD threats, but differing operational exposure results in Flynn rated MEDIUM risk and Samir rated HIGH risk.
Exposure Drives Probability
With 160,000 flights/year vs 20,000, Samir's preventive barriers are tested significantly more often, increasing the chance of failure.
Controls Remain Critical
Despite different risk ratings, both operators rely on the same preventive controls: runway inspections, staff training, and SMS.
AI CONTRIBUTION ACKNOWLEDGEMENT
Samir Shaon
Flynn McCarthy Wallace
Used AI to rephrase wording for professional grammar
Used AI to supplement knowledge gaps for thorough coverage
Used AI to assist with sourcing references
AI was used as a writing and research aid only. All academic arguments and analysis are the authors' own.
- airline-operations
- aviation-management
- british-airways
- easyjet
- logistics
- flight-safety
- business-analysis