Mastering Tableau: Dimensions, Measures, and Filters
Learn the fundamentals of Tableau including dimensions vs measures, data extracts, and the order of operations for quick and context filters.
TECHNICAL PRESENTATION
Mastering Tableau
Dimensions, Measures, Data Sources, Extracts & Filters
Presenter 1 · Slides 1–4
Presenter 2 · Slides 5–8
6-Minute Technical Walkthrough
PRESENTER 1
What We'll Cover Today
Presenter 1: Slides 1–4 | Presenter 2: Slides 5–8
📐
Dimensions
Categorical fields that define structure
📏
Measures
Numeric fields for quantitative analysis
🗄️
Data Source
Connecting Tableau to your data
⚡
Extract
Offline snapshot for fast performance
🔍
Quick Filters
Interactive, user-driven filtering
🎯
Context Filters
Layered filtering for precision
PRESENTER 1 · TOPIC 1
Dimensions & Measures
Dimensions
Qualitative fields — WHO, WHAT, WHERE
Customer Name, Region, Product Category
Create headers and group data
Appear as ROWS or COLUMNS
Displayed in <b>BLUE</b> in Tableau's data pane
Measures
Quantitative fields — HOW MUCH, HOW MANY
Sales, Profit, Quantity, Discount
Aggregated: SUM, AVG, COUNT, MIN, MAX
Drive chart axes and size
Displayed in <b>GREEN</b> in Tableau's data pane
💡 Tip: Tableau auto-classifies fields — but you can convert Dimensions ↔ Measures by right-clicking!
Speaker Note: Show how dragging a Dimension creates category headers; a Measure creates a numeric axis.
Data Source & Extract
The connection between Tableau and your data (Excel, SQL, Google Sheets, etc.)
Real-time data refresh
Multiple sources can be joined/blended
Managed via the Data Source tab
A saved static copy of your data stored locally as a .hyper file
Faster performance on large datasets
Works offline — no live server needed
Scheduled refreshes keep data current
Pro Tip: Use Extracts for dashboards with millions of rows!
PRESENTER 2 · TOPIC 3
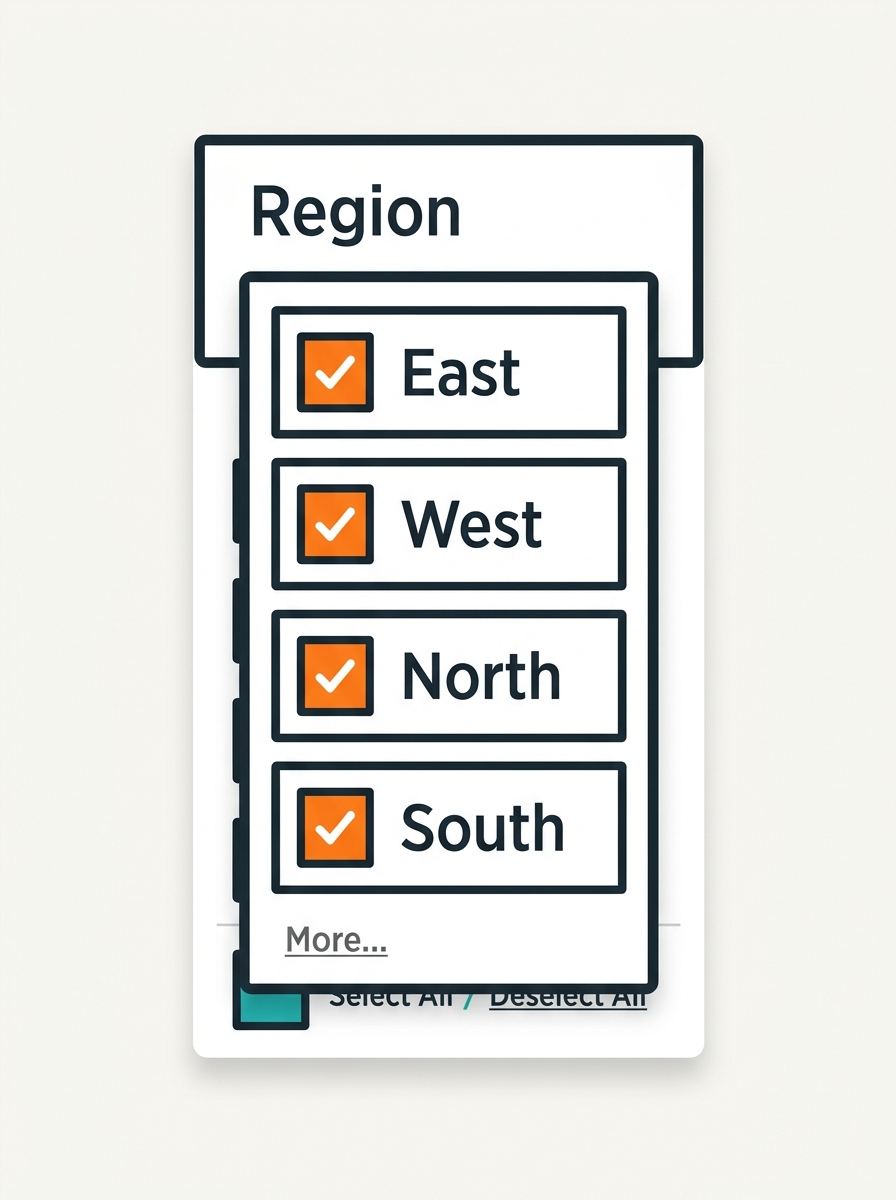
Quick Filters
Interactive filter controls shown on the dashboard for users to slice data on the fly.
Appear as dropdown, slider, checkbox, or search box
Applied AFTER the query runs
Affect only the worksheet they're added to (by default)
Can be shared across multiple sheets
Data Query
Quick Filter Applied
View Updates
Speaker Note: Demo Quick Filter by right-clicking a dimension → Show Filter.
PRESENTER 2 · TOPIC 4
Context Filters
Extract Filters
🎯 Context Filters
Dimension Filters
Measure Filters
Filtering Order of Operations
Tableau Walkthrough
06
PRESENTER 2 · USE CASE
Putting It All Together
Scenario: Analyzing Sales Performance by Region for a Retail Company
🗄️ Data Source
Connect to Excel
⚡ Extract
.hyper file
📐 Dimensions
Region, Category
📏 Measures
SUM(Sales)
🎯 Filters
Context + Quick
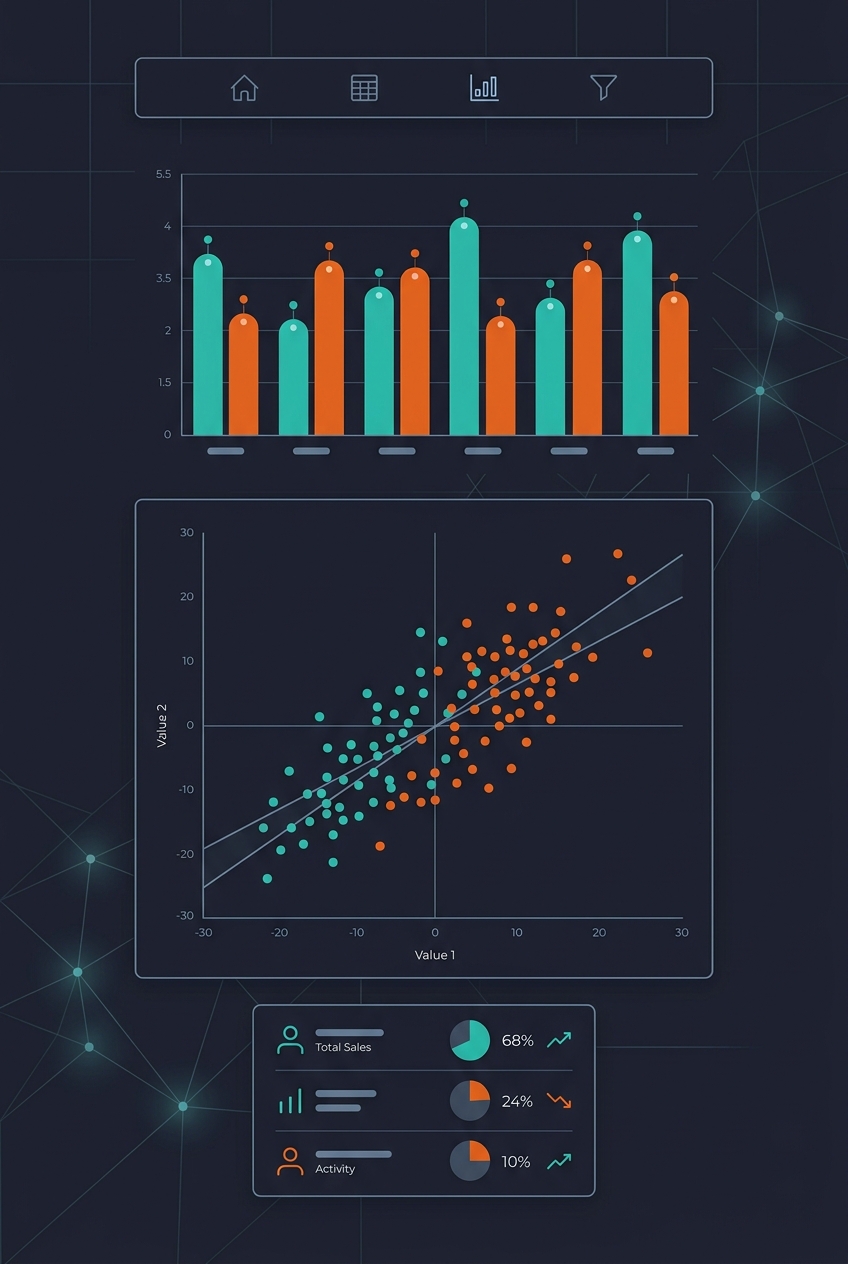
📊 Output: A bar chart showing Top 10 Sub-Categories by Sales in Technology, with a Region Quick Filter for interactivity.
✅ Faster with Extract
✅ Context ensures correct Top N
✅ Dimensions define chart structure
Speaker Note: Walk through each step as if building this dashboard live in Tableau.
WRAP UP
Key Takeaways
Dimensions
— Qualitative fields that structure your view
Measures
— Numeric fields for calculations & aggregation
Data Source
— Your live or connected data pipeline
Extract
— Fast offline .hyper snapshot for performance
Quick Filters
— User-driven interactive slicing on dashboards
Context Filters
— Priority filter for precise Top N results
"Tableau turns data into decisions."
Thank You!
Questions & Discussion
Presenter 1
Presenter 2
Mastering Tableau · June 2026
- tableau
- data-visualization
- business-intelligence
- analytics-tutorial
- data-science
- dashboard-design