


Strategic Analysis: ₹1000 Cr Indian Pharma Leader Outlook
Explore a comprehensive strategic analysis of Nexus Pharmachem, an Indian pharma leader, covering financial performance, SWOT, R&D, and global market expansion.
Project Nexus: Information Memorandum
Comprehensive Analysis of a ₹1,000 Cr Mid-Cap Indian Pharmaceutical Enterprise
December 2025
Executive Summary
<div style='display:flex; flex-direction:column; gap:20px;'><div style='background:#f4f7f9; padding:20px; border-left:5px solid #0056b3;'><h3 style='margin:0; color:#0056b3;'>Financial Milestone</h3><p style='margin:10px 0 0 0; color:#444;'>Crucial inflection point reached with FY25 revenue crossing <b>₹1,050 Crores</b>, establishing 'Nexus Pharmachem' as a serious mid-cap contender.</p></div><div style='background:#f4f7f9; padding:20px; border-left:5px solid #0056b3;'><h3 style='margin:0; color:#0056b3;'>Strategic Focus</h3><p style='margin:10px 0 0 0; color:#444;'>Diversified portfolio across APIs (60%) and Finished Dosages (40%), with emerging focus on CDMO for regulated markets.</p></div><div style='background:#f4f7f9; padding:20px; border-left:5px solid #0056b3;'><h3 style='margin:0; color:#0056b3;'>Future Outlook</h3><p style='margin:10px 0 0 0; color:#444;'>Projected CAGR of 18% over the next 3 years, driven by PLI scheme benefits and capacity expansion in Hyderabad and Vizag facilities.</p></div></div>
Indian Pharma Industry Overview
<ul><li><b>Market Valuation:</b> The Indian pharmaceutical sector is valued at approximately $55-60 Billion (2025), poised to reach $130 Billion by 2030.</li><br><li><b>Global Position:</b> Ranked 3rd worldwide by production volume and 14th by value. Known as the 'Pharmacy of the World' supplying 40% of generic demand in the US.</li><br><li><b>Key Growth Drivers:</b><br>- Patent Cliff: $240B worth of drugs going off-patent.<br>- Government PLI Schemes: Incentives for domestic API synthesis.<br>- Biosimilars: Rising adoption in chronic therapies.</li></ul>
Company Overview: Nexus Pharmachem
Established in 2008, Headquartered in Hyderabad, India.
Listed on NSE/BSE with a market cap of approximately ₹3,800 Cr.
Operates 3 US-FDA approved manufacturing facilities.
Workforce of 1,200+ employees including 150+ R&D Scientists.
Primary export markets: USA (35%), Europe (25%), APAC (15%).
Business Verticals & Revenue Contribution
Detailed breakdown of FY2025 Revenue Streams.<br><br><b>Key Insights:</b><br>• Core API business remains the cash cow contributing nearly 55%.<br>• Finished Dosage Formulations (FDF) has grown 12% YoY.<br>• NEW: Contract Devel & Mfg (CDMO) is the fastest-growing vertical.
Recent Financial Performance (FY23-FY25)
Revenue has grown at a CAGR of 13.5% over the last three years, successfully crossing the ₹1,000 Crore milestone in FY25.<br><br>EBITDA margins have stabilized at 18.5% despite raw material inflation.
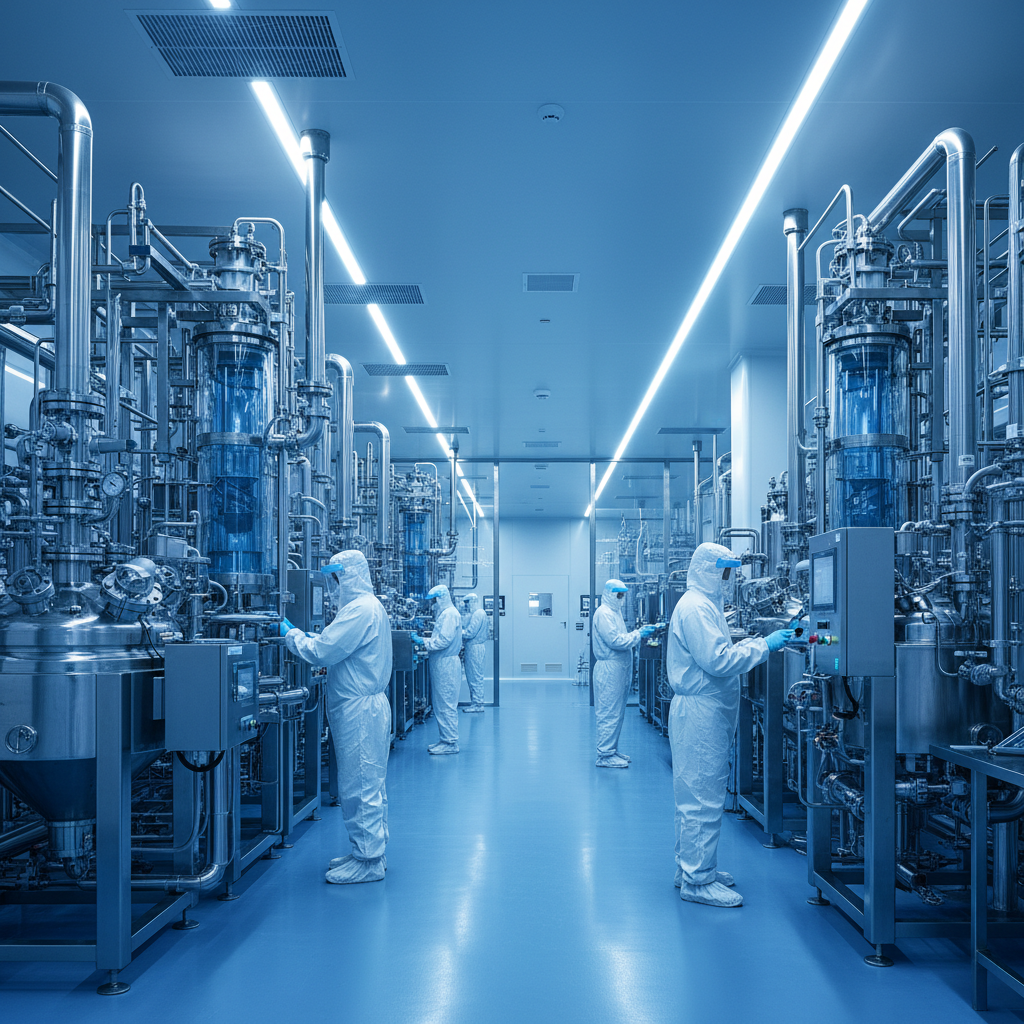
Infrastructure & Manufacturing
<b>Unit 1 (Hyderabad):</b> Specializes in API synthesis with variable batch sizes. ISO 14001, OHSAS 18001 certified.<br><br><b>Unit 2 (Vizag SEZ):</b> Dedicated to export-oriented finished dosages (Tablets/Capsules). FDA & EMA approved.<br><br><b>R&D Center:</b> State-of-the-art facility focused on complex generics and new drug delivery systems (NDDS).
Future Financial Projections (FY26-FY28)
Based on current order book and capacity expansion, we project a confident path to ₹1,700 Cr by FY28.<br><br>Growth drivers: Launch of 4 new molecules in Oncology space and expansion of US generics exports.
Competitive Landscape & Benchmarking
Granules India: Major competitor in API/Intermediates, significantly larger scale (₹4400 Cr+).
Marksans Pharma: Competes in the regulated formulation space (UK/US markets).
SMS Pharma: Direct competitor in specific API therapeutic categories.
Bliss GVS: Competitor in niche formulations and African market exports.
Competitive Advantage: Our fully integrated value chain from Intermediate > API > Formulation allows for 15-20% better operating margins compared to pure-play formulators.
KPIs & Operational Metrics
<ul><li><b>EBITDA Margin:</b> 18.5% (Industry avg: 16%)</li><br><li><b>ROCE:</b> 22% (Return on Capital Employed)</li><br><li><b>Net Debt/Equity:</b> 0.4x (Healthy leverage)</li><br><li><b>R&D Intensity:</b> 6% of Revenue invested in innovation</li><br><li><b>Capacity Utilization:</b> 85% across all 3 units</li></ul>
With a fortified balance sheet and a robust pipeline of complex generics, we are poised to double our turnover in the next 4 years while maintaining best-in-class compliance standards.
Dr. R.K. Mehta, Managing Director
SWOT Analysis
• 3 US-FDA approved facilities<br>• Strong backward integration in APIs<br>• R&D spend >8% of sales<br>• Diversified product portfolio (Cardio, Neuro, Anti-diabetic)
• High revenue dependence on US market (35%)<br>• Limited presence in branded formulations<br>• Higher working capital cycle vs peers
• Expansion into Biosimilars & Complex Injectables<br>• Growing CDMO market trend<br>• Patent expirations in key molecules worth $5B+<br>• Emerging markets (LATAM, APAC) expansion
• Regulatory scrutiny (USFDA observations)<br>• Pricing pressure in US generics<br>• Raw material price volatility (Solvents/KSMs)<br>• Currency fluctuation risks
Strength Deep Dive: Manufacturing & R&D
<p><b>Regulatory Excellence:</b> Our 3 manufacturing units have consistently cleared USFDA, EMA, and PMDA inspections with zero critical observations in the last 5 years.</p><p style='margin-top:30px;'><b>Vertical Integration:</b> 70% of our Formulations use in-house APIs, ensuring supply security and cost leadership (margins 200-300 bps higher than peers).</p><p style='margin-top:30px;'><b>Innovation Engine:</b> Dedicated R&D center with 150+ scientists filing 12-15 ANDAs annually.</p>
Addressing Weaknesses & Risks
<p><b>Geographic Concentration:</b> The US market contributes ~35% of revenues. While profitable, this exposes the company to specific regulatory and pricing risks of a single geography.</p><p style='margin-top:30px;'><b>Portfolio Gaps:</b> Current portfolio is heavily skewed towards oral solids. Absence in high-value sterile injectables limits margin expansion in the short term.</p><p style='margin-top:30px;'><b>Working Capital:</b> Extended inventory cycles for raw materials have led to a working capital cycle of 110 days, higher than the industry average of 90 days.</p>
Strategic Opportunities
<p><b>CDMO Expansion:</b> The global CDMO market is growing at 12%. Nexus is positioning itself as a preferred partner for Big Pharma, leveraging its cost-efficient Indian manufacturing base.</p><p style='margin-top:30px;'><b>Specialty Chemicals:</b> Diverting intermediate capabilities to specialty chemicals for agro/personal care can unlock a new revenue stream with higher entry barriers.</p><p style='margin-top:30px;'><b>Biosimilars Entry:</b> Partnership-led model to enter the $15B biosimilars market by FY2027.</p>
External Threats & Challenges
<p><b>Regulatory Risks:</b> Stringent audits by USFDA. Any import alert could significantly impact top-line revenue.</p><p style='margin-top:30px;'><b>Pricing Pressure:</b> Customer consolidation in the US (buying groups) continues to drive generic prices down by mid-single digits annually.</p><p style='margin-top:30px;'><b>Supply Chain:</b> Reliance on China for Key Starting Materials (KSMs). Geopolitical tension could disrupt supply; however, we are mitigating this via "China Plus One" sourcing.</p>
Strategic Actions: Countering Threats
Leveraging Core Competencies
Key Financial Highlights (FY22-FY24)
Revenue & EBITDA Growth Trends
Robust double-digit growth driven by volume expansion in API and price stability in formulations.<br><br>• <b>Revenue CAGR 12%:</b> Consistent top-line growth.<br>• <b>EBITDA CAGR 22%:</b> Operating leverage kicking in, leading to faster bottom-line expansion.<br>• <b>FY24 Outlook:</b> Expected to cross ₹1,200 Cr.
Margin Trajectory
• <b>Gross Margin Expansion:</b> Improved from 55% to 62% due to backward integration into KSMs.<br>• <b>EBITDA Margin:</b> Scaled to 24%, best-in-class for mid-cap pharma.<br>• <b>Sustainability:</b> Structural cost savings suggest margins will sustain >22% levels.
Balance Sheet Strength
<p><b>Deleveraging:</b> Net Debt/Equity reduced from 0.8x to 0.4x, indicating strong free cash flow generation.</p><p style='margin-top:30px;'><b>Liquidity:</b> Current Ratio improved to 1.8x, ensuring comfortable working capital management.</p><p style='margin-top:30px;'><b>Credit Rating:</b> Upgraded to 'AA-' by CRISIL in FY24.</p>
Return on Invested Capital
• <b>ROCE Expansion:</b> Capital efficiency has improved as recent capex started contributing to revenue.<br>• <b>ROE > 18%:</b> Shareholders equity is compounding at healthy rates.<br>• <b>Asset Turnover:</b> Increased utilization of new capacity.
Summary & Conclusion
Investment Rationale & Contact
<div style='display:flex; justify-content:space-between; gap:40px;'><div style='flex:1;'><h3 style='color:#0056b3; font-size:32px;'>Why Invest?</h3><ul style='font-size:22px; color:#444; line-height:1.8;'><li><b>Undervalued Growth:</b> Trading at attractive valuations compared to large-cap peers.</li><li><b>Export Driver:</b> Increasing share of revenue from regulated markets (US/EU).</li><li><b>Capacity Ready:</b> Infra capex already incurred; now entering asset sweating phase.</li></ul></div><div style='flex:1; background:#f0f2f5; padding:30px; border-radius:10px;'><h3 style='color:#0056b3; font-size:32px;'>Contact Investor Relations</h3><p style='font-size:22px; color:#444;'><b>Email:</b> ir@nexuspharmachem.com<br><b>Phone:</b> +91 40 2345 6789<br><b>Address:</b> Financial District, Gachibowli, Hyderabad, India.</p><p style='font-size:16px; color:#888; margin-top:40px;'><i>Disclaimer: This document is for information purposes only and does not constitute an offer to sell securities. Projections are based on management estimates.</i></p></div></div>
- pharmaceutical-industry
- indian-pharma
- api-manufacturing
- business-strategy
- financial-analysis
- cdmo
- nexus-pharmachem
- market-outlook