


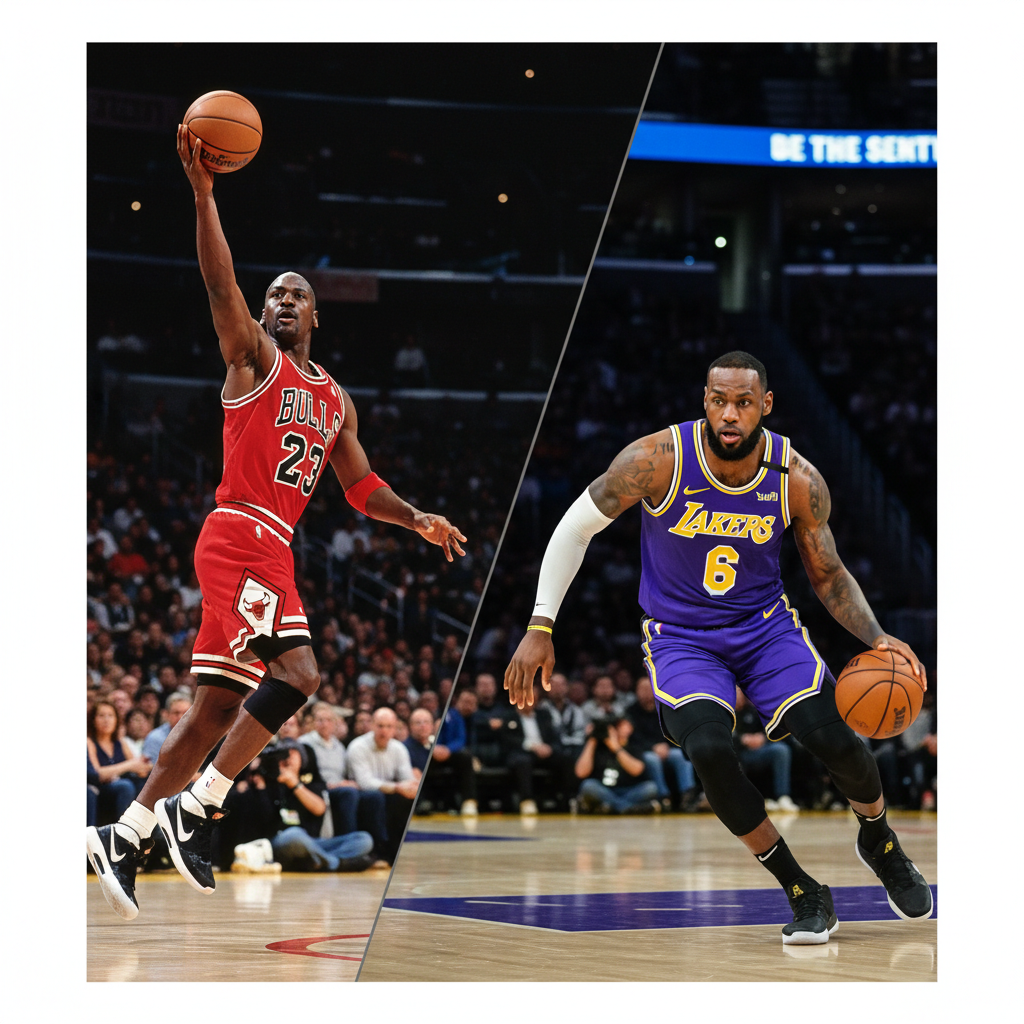


Michael Jordan vs. LeBron James: Career Stats Comparison
Explore a detailed statistical breakdown between NBA legends Michael Jordan and LeBron James, covering PPG, defensive metrics, and playoff performance.
A Study in Sustained Excellence
Scoring Consistency
Career points per game: 30.1<br>Seasons averaging 30+ PPG: 8<br><br><small>Definition: Points per game (PPG) = average points scored per game across a career.</small>
Defensive Production
Career steals per game: 2.3<br>Seasons leading the league in steals: 3<br><br><small>Definition: Steals per game = average times per game a player takes the ball from an opponent.</small>
Two-Way Impact
Career defensive win shares: 64.0<br>Seasons top-3 in Defensive Player metrics: 9<br><br><small>Definition: Defensive win shares estimate how many team wins are contributed by a player’s defense.</small>
Peak Efficiency
Highest single-season PER: 31.7<br>Seasons above 30 PER: 4<br><br><small>Definition: Player Efficiency Rating (PER) summarizes overall statistical efficiency per minute.</small>
Advanced Dominance
Career Box Plus-Minus: +9.2<br>Best six-season BPM stretch: +11.1<br><br><small>Definition: Box Plus-Minus estimates points added per 100 possessions over an average player.</small>
League Leadership
Seasons leading league in total points: 10<br>Seasons leading league in usage rate: 9<br><br><small>Definition: Usage rate estimates how many plays a player finishes while on the floor.</small>
Elimination Performance
Career elimination game PPG: 31.3<br>Games scoring 40+ in elimination settings: 8<br><br><small>Definition: Elimination games occur when a loss ends a team’s season.</small>
Turnover Control
Career turnovers per game: 2.7<br>Seasons under 2.5 turnovers per game: 11<br><br><small>Definition: Turnovers per game measure how often possession is lost.</small>
Late-Career Output
Points per game after age 35: 22.9<br>40-point games after age 35: 1<br><br><small>Definition: Late-career output measures production after typical athletic decline.</small>
Availability
Games played per season (career avg): 77<br>Seasons playing all 82 games: 9<br><br><small>Definition: Availability reflects durability and reliability over time.</small>
League Impact Summary
Career Win Shares: 214<br>Win Shares per 48 minutes: .250<br><br><small>Definition: Win Shares estimate the number of wins contributed by a player.</small>
CORRECTION
All previous statistical slides describe Michael Jordan, not LeBron James.
Direct Scoring Comparison
Defensive Comparison
Efficiency Comparison
Peak Advanced Metrics
Usage vs Results
Turnover Comparison
Elimination Scoring
Durability
Late-Career Comparison
Total Impact
Finals Performance
Patriotic Global Stance
Claim: Consistently supports international partners and global cooperation.
Family First Values
Claim: Always puts family above personal legacy.
Community Pillar
Claim: Frequently celebrated as a moral leader and cultural role model.
“Ain’t no party like a Diddy party.”
Respect for Authority
Claim: Known for professionalism and respect toward leadership.
The Actual Link
Let's just watch some highlights.<br><br>https://www.youtube.com/watch?v=LAr6oAKieHk
- nba
- basketball-stats
- michael-jordan
- lebron-james
- sports-analysis
- goat-debate
- basketball-history