Drug-Receptor Interaction: Pharmacodynamics & Dose-Response
Master pharmacodynamics: Learn about receptor theory, graded vs quantal dose-response curves, potency, efficacy, and therapeutic index calculation.
Quantitation of Drug-Receptor Interaction
& Elicited Effects
Pharmacodynamics | Receptor Theory | Dose-Response Relationships
Department of Pharmacology
Medical/Pharmacy Students
Lecture Outline
1
Introduction to Drug-Receptor Theory
2
Receptor Occupancy & Binding
3
Graded Dose-Response Curves
4
Quantal Dose-Response Curves
5
Efficacy, Potency & Affinity
6
Agonists, Antagonists & Partial Agonists
7
Therapeutic & Toxic Ratios
8
Clinical Relevance
Introduction to Drug-Receptor Theory
A receptor is a macromolecule (protein) that specifically binds a drug/ligand
Binding triggers a biological response (signal transduction)
Receptors can be membrane-bound, nuclear, or intracellular
Most drugs act by binding to specific receptors — "lock and key" model
"The receptor is the structural protein that senses the drug signal and converts it to a biological response."
Drug (Ligand)
Receptor
Cell Membrane
Second Messenger
Receptor Occupancy Theory
The Clark Model (1926)
Effect is proportional to the fraction of receptors occupied by drug
D + R ⇌ DR → Effect
At maximum effect, all receptors are occupied
Occupancy Formula
Fractional Occupancy = [D] / (Kd + [D])
drug concentration
dissociation constant
Department of Pharmacology
Medical / Pharmacy Students
Graded Dose-Response Curves
Definition
Measures the magnitude of response in a single subject/tissue
Response increases gradually with increasing dose
Plotted as: Effect (%) on Y-axis vs Log [Drug Dose] on X-axis
Produces a characteristic S-shaped (sigmoidal) curve
Key Parameters from the Curve
Emax
Maximum possible effect
EC50
Concentration producing 50% of Emax
Slope
Steepness of the dose-response curve
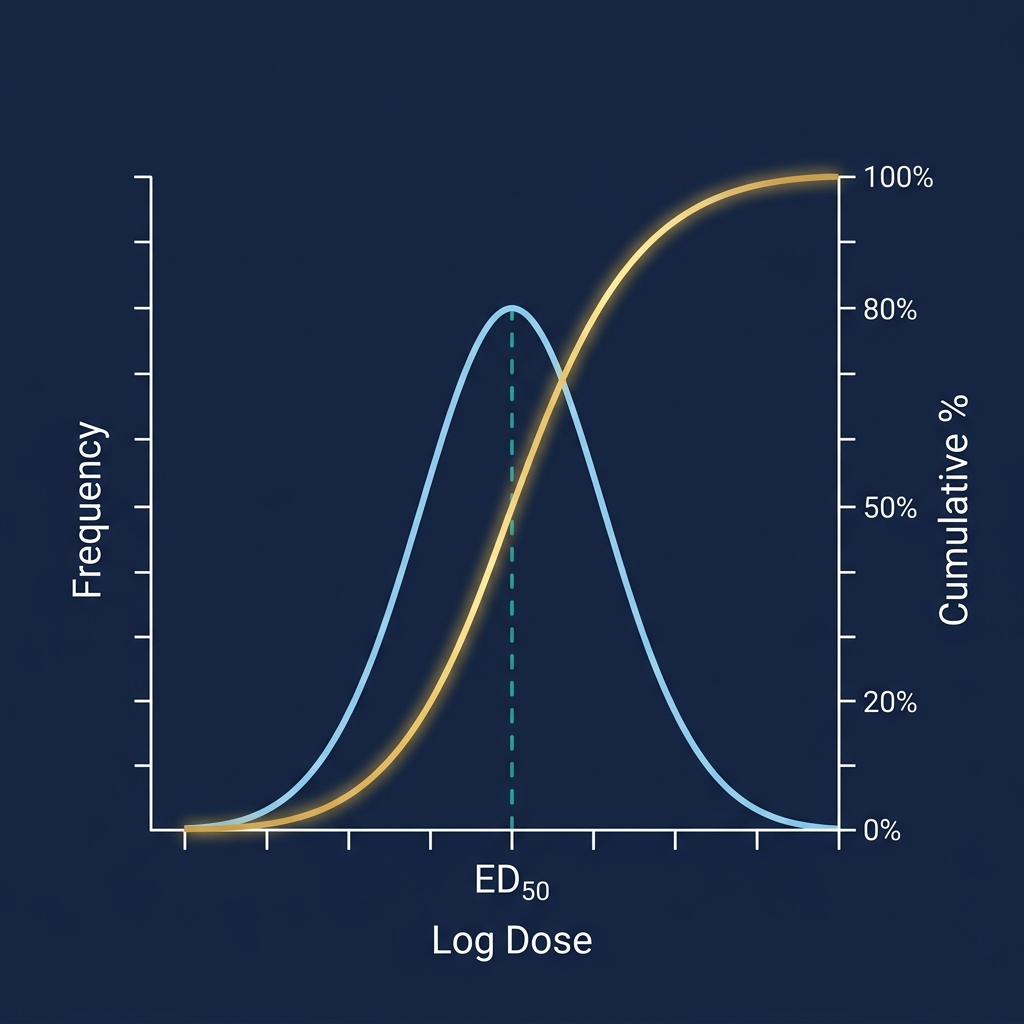
Quantal Dose-Response Curves
Definition
Measures the proportion of a population that responds to a given dose
All-or-nothing response (responds or does not respond)
Plotted as: % Population Responding vs Log Dose
Results in a cumulative S-shaped curve
Key Statistical Parameters
ED50 — Dose effective in 50% of population
TD50 — Dose toxic in 50% of population
LD50 — Lethal dose in 50% of population
These parameters are derived from the quantal DRC
Potency & Efficacy
Potency
The amount of drug needed to produce a given effect. Measured by EC<sub style="font-size: 0.7em;">50</sub> — lower EC<sub style="font-size: 0.7em;">50</sub> = higher potency.
Drug A (EC<sub style="font-size: 0.7em;">50</sub>=1mg) is MORE potent than Drug B (EC<sub style="font-size: 0.7em;">50</sub>=10mg)
Potency ≠ Safety
Efficacy (E<sub style="font-size: 0.7em;">max</sub>)
The maximum effect a drug can produce regardless of dose. Intrinsic property of the drug-receptor interaction.
A drug with higher E<sub style="font-size: 0.7em;">max</sub> has greater intrinsic efficacy
Efficacy is clinically more important than potency
Affinity (K<sub style="font-size: 0.7em;">d</sub>)
The strength of binding between drug and receptor. Low K<sub style="font-size: 0.7em;">d</sub> = High affinity = strong binding.
K<sub style="font-size: 0.7em;">d</sub> = [D][R] / [DR]
Inversely related to K<sub style="font-size: 0.7em;">d</sub> value
<svg width="34" height="34" viewBox="0 0 24 24" fill="none" stroke="#C9A84C" stroke-width="2.5" stroke-linecap="round" stroke-linejoin="round"><circle cx="12" cy="12" r="10"></circle><circle cx="12" cy="12" r="6"></circle><circle cx="12" cy="12" r="2"></circle></svg>
<svg width="34" height="34" viewBox="0 0 24 24" fill="none" stroke="#C9A84C" stroke-width="2.5" stroke-linecap="round" stroke-linejoin="round"><line x1="12" y1="20" x2="12" y2="10"></line><line x1="18" y1="20" x2="18" y2="4"></line><line x1="6" y1="20" x2="6" y2="16"></line></svg>
<svg width="34" height="34" viewBox="0 0 24 24" fill="none" stroke="#C9A84C" stroke-width="2.5" stroke-linecap="round" stroke-linejoin="round"><circle cx="18" cy="18" r="3"></circle><circle cx="6" cy="6" r="3"></circle><path d="M15.88 15.88L8.12 8.12"></path><circle cx="18" cy="6" r="3"></circle><path d="M18 15v-6"></path></svg>
<svg width="1140" height="420" viewBox="0 0 1140 420" style="overflow: visible; font-family: system-ui, -apple-system, sans-serif;"> <defs> <filter id="glowA" x="-20%" y="-20%" width="140%" height="140%"> <feGaussianBlur stdDeviation="4" result="blur" /> <feComposite in="SourceGraphic" in2="blur" operator="over" /> </filter> </defs> <!-- Grid lines --> <path d="M 120 255 L 1020 255" stroke="#889AAB" stroke-width="1" stroke-dasharray="3 5" opacity="0.15" /> <path d="M 120 190 L 1020 190" stroke="#889AAB" stroke-width="1" stroke-dasharray="3 5" opacity="0.15" /> <path d="M 120 125 L 1020 125" stroke="#889AAB" stroke-width="1" stroke-dasharray="3 5" opacity="0.15" /> <!-- Emax Lines --> <path d="M 120 60 L 1020 60" stroke="#889AAB" stroke-width="2" stroke-dasharray="8 6" opacity="0.4" /> <text x="100" y="65" text-anchor="end" fill="#889AAB" font-size="16" font-weight="600">100%</text> <text x="1035" y="65" text-anchor="start" fill="#889AAB" font-size="18" font-style="italic">E<tspan baseline-shift="sub" font-size="14">max</tspan> (A, B)</text> <path d="M 120 160 L 1020 160" stroke="#E57373" stroke-width="2" stroke-dasharray="8 6" opacity="0.6" /> <text x="100" y="165" text-anchor="end" fill="#E57373" font-size="16" font-weight="600">~60%</text> <text x="1035" y="165" text-anchor="start" fill="#E57373" font-size="18" font-style="italic">E<tspan baseline-shift="sub" font-size="14">max</tspan> (C)</text> <!-- Axes --> <path d="M 120 40 L 120 320 L 1040 320" stroke="#889AAB" stroke-width="3" fill="none" stroke-linecap="round" stroke-linejoin="round" /> <text x="100" y="325" text-anchor="end" fill="#889AAB" font-size="16" font-weight="600">0%</text> <text x="-180" y="50" transform="rotate(-90)" fill="#889AAB" font-size="18" font-weight="600" letter-spacing="1px" text-anchor="middle">Response (% of Max)</text> <text x="580" y="380" text-anchor="middle" fill="#889AAB" font-size="18" font-weight="600" letter-spacing="1px">Log [Drug Concentration]</text> <!-- Sigmoidal Curves --> <!-- Drug A: Gold --> <path d="M 120 320 L 180 320 C 300 320, 300 60, 420 60 L 1020 60" stroke="#C9A84C" stroke-width="5" fill="none" stroke-linecap="round" filter="url(#glowA)" /> <!-- Drug B: Teal --> <path d="M 120 320 L 380 320 C 500 320, 500 60, 620 60 L 1020 60" stroke="#7EC8E3" stroke-width="5" fill="none" stroke-linecap="round" /> <!-- Drug C: Red/Coral --> <path d="M 120 320 L 280 320 C 400 320, 400 160, 520 160 L 1020 160" stroke="#E57373" stroke-width="5" fill="none" stroke-linecap="round" /> <!-- Curve Labels --> <text x="330" y="45" text-anchor="middle" fill="#C9A84C" font-size="22" font-weight="800">Drug A</text> <text x="730" y="45" text-anchor="middle" fill="#7EC8E3" font-size="22" font-weight="800">Drug B</text> <text x="630" y="145" text-anchor="middle" fill="#E57373" font-size="22" font-weight="800">Drug C</text> <!-- EC50 Vertical Drop Lines --> <!-- Drug A --> <path d="M 300 190 L 300 320" stroke="#C9A84C" stroke-width="2" stroke-dasharray="5 5" fill="none" /> <text x="300" y="345" text-anchor="middle" fill="#C9A84C" font-size="18" font-weight="600">EC<tspan baseline-shift="sub" font-size="14">50</tspan> A</text> <circle cx="300" cy="190" r="5.5" fill="#152C50" stroke="#C9A84C" stroke-width="3" /> <!-- Drug B --> <path d="M 500 190 L 500 320" stroke="#7EC8E3" stroke-width="2" stroke-dasharray="5 5" fill="none" /> <text x="500" y="345" text-anchor="middle" fill="#7EC8E3" font-size="18" font-weight="600">EC<tspan baseline-shift="sub" font-size="14">50</tspan> B</text> <circle cx="500" cy="190" r="5.5" fill="#152C50" stroke="#7EC8E3" stroke-width="3" /> <!-- Drug C --> <path d="M 400 240 L 400 320" stroke="#E57373" stroke-width="2" stroke-dasharray="5 5" fill="none" /> <text x="400" y="345" text-anchor="middle" fill="#E57373" font-size="18" font-weight="600">EC<tspan baseline-shift="sub" font-size="14">50</tspan> C</text> <circle cx="400" cy="240" r="5.5" fill="#152C50" stroke="#E57373" stroke-width="3" /> <!-- Annotation Arrows --> <!-- Potency Difference (A to B) --> <g stroke="#A0AAB5" stroke-width="2" fill="none"> <path d="M 315 260 L 485 260" stroke-dasharray="2 4" /> <path d="M 475 253 L 485 260 L 475 267" stroke-dasharray="0" stroke-linecap="round" stroke-linejoin="round" /> </g> <text x="400" y="250" text-anchor="middle" fill="#A0AAB5" font-size="15" font-style="italic">Decreasing Potency</text> <!-- Efficacy Difference (A to C) --> <g stroke="#E57373" stroke-width="2" fill="none"> <path d="M 850 75 L 850 145" stroke-dasharray="2 4" /> <path d="M 843 135 L 850 145 L 857 135" stroke-dasharray="0" stroke-linecap="round" stroke-linejoin="round"/> </g> <text x="865" y="115" fill="#E57373" font-size="16" alignment-baseline="middle" font-style="italic">Lower Emax</text> </svg>
Agonists & Antagonists
AGONISTS
ANTAGONISTS
Full Agonist
Binds receptor and produces MAXIMUM response.
High intrinsic efficacy (α=1)
Example: Morphine, Adrenaline
Partial Agonist
Binds receptor but produces SUBMAXIMAL response.
Intermediate intrinsic efficacy (0<α<1)
Example: Buprenorphine
Inverse Agonist
Binds receptor and produces OPPOSITE effect.
Negative intrinsic efficacy (α<0)
Example: β-carbolines
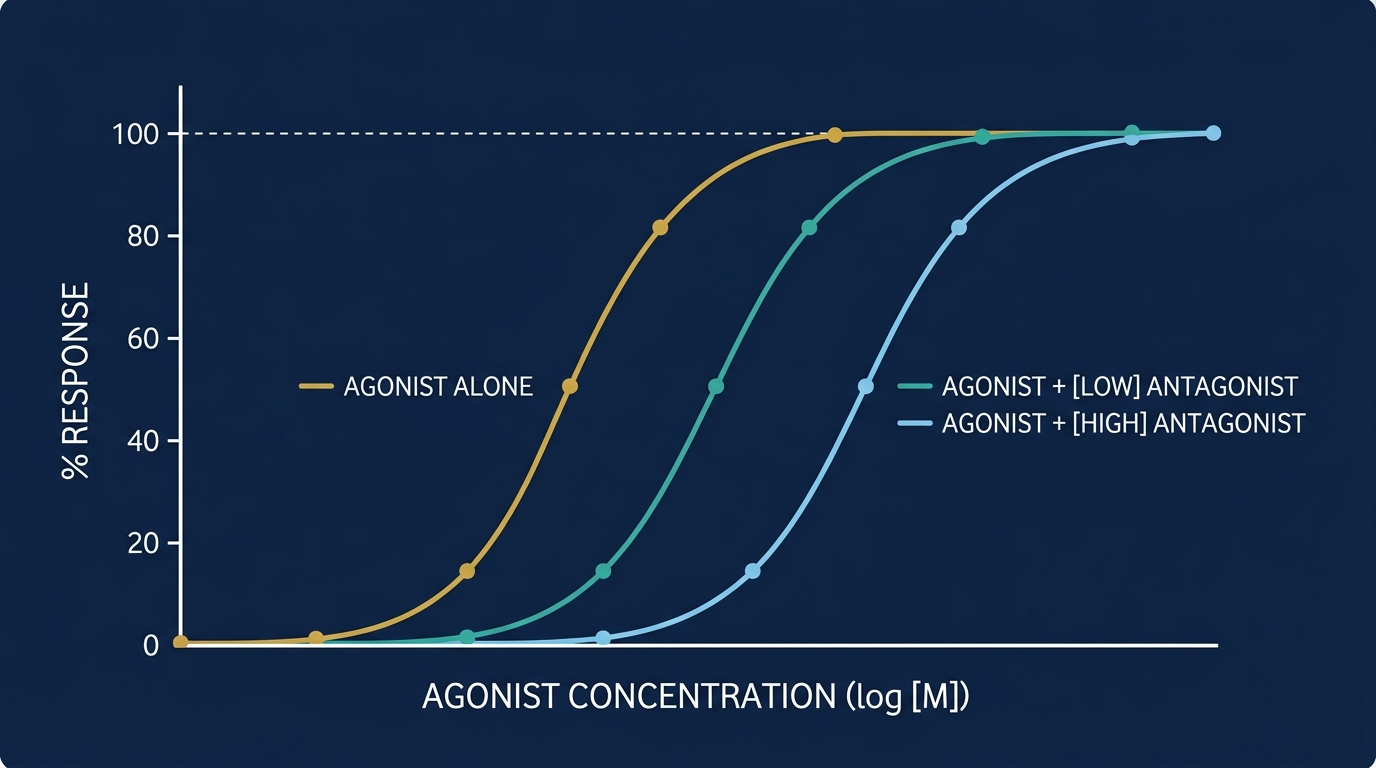
Competitive Antagonist
Competes with agonist for same receptor site.
Effect REVERSIBLE by increasing agonist concentration.
Shifts DRC to the right (parallel shift).
Example: Atropine, Naloxone
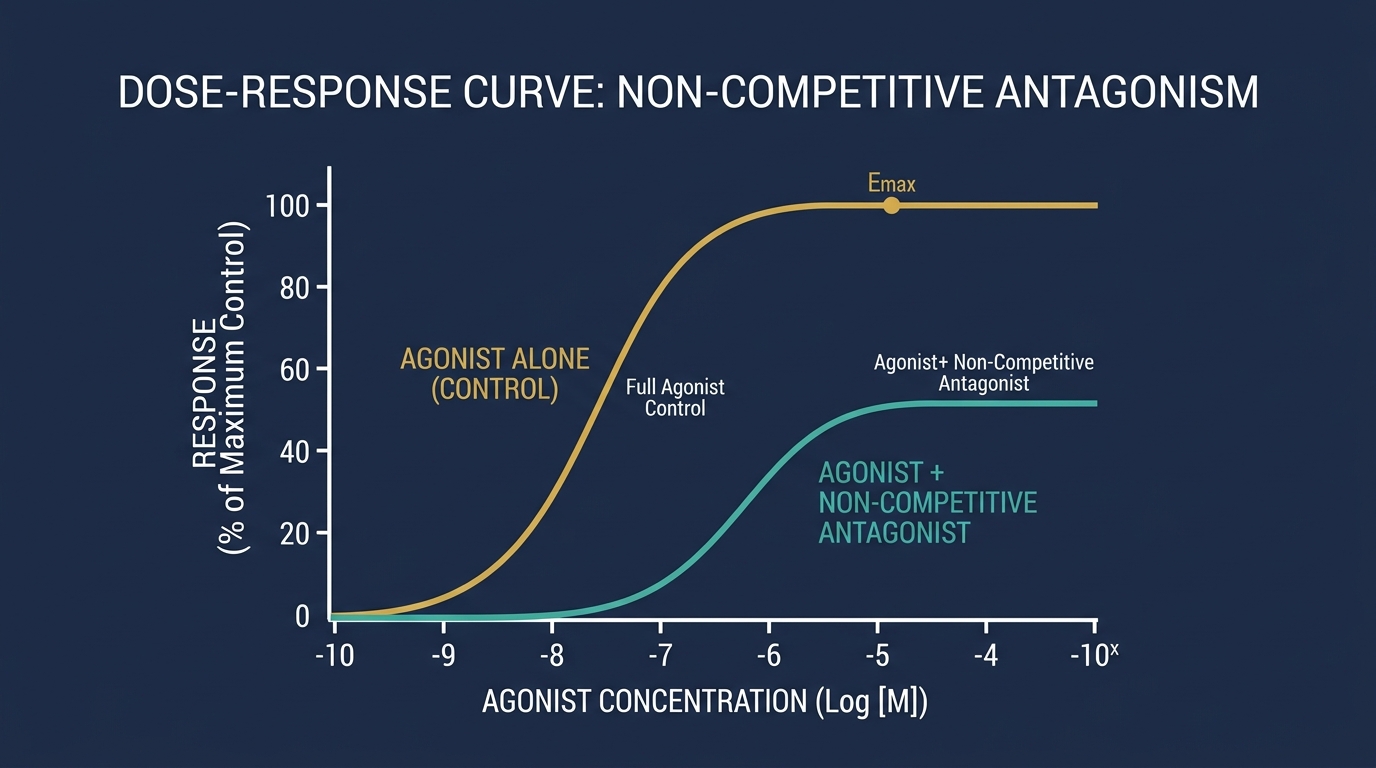
Non-competitive Antagonist
Binds irreversibly or at allosteric site.
DEPRESSES Emax. Cannot be overcome by increasing agonist.
Example: Phenoxybenzamine
Competitive vs Non-Competitive Antagonism
Competitive Antagonism
Non-Competitive Antagonism
Therapeutic Index & Safety Ratios
Therapeutic Index (TI)
A measure of drug safety — ratio of toxic dose to effective dose.
TI = TD<sub>50</sub> / ED<sub>50</sub>
(or in animal studies: TI = LD<sub>50</sub> / ED<sub>50</sub>)
Higher TI = Safer drug (wider margin between effective and toxic doses)
Certain Safety Factor (CSF)
CSF = TD<sub>1</sub> / ED<sub>99</sub>
More conservative — uses the lowest toxic dose vs highest effective dose
Therapeutic Window
Range of doses between minimum effective concentration (MEC) and minimum toxic concentration (MTC). Drug must stay within this range for optimal therapy.
Pharmacology Fundamentals
Pharmacokinetics & Dynamics
Spare Receptors & Receptor Reserve
Concept of Spare Receptors
Implications
Maximum effect can be achieved even when only a <strong style="color: #7EC8E3; font-weight: 800;">FRACTION</strong> of receptors are occupied
Remaining unoccupied receptors are called "spare receptors" or "receptor reserve"
First demonstrated by Stephenson (1956)
Spare receptors increase sensitivity to agonist (leftward shift of DRC)
<strong style="color: #C9A84C; font-weight: 800; letter-spacing: 1px;">EC<sub style="font-size: 14px; margin-left: 1px;">50</sub> < K<sub style="font-size: 14px; margin-left: 1px;">d</sub></strong> (EC<sub style="font-size: 14px; margin-left: 1px;">50</sub> is lower than dissociation constant)
Even if some receptors are blocked, full response may still occur
Tissues with more spare receptors are more sensitive to agonists
Important in understanding tolerance and drug resistance
Total Receptors (100%)
Department of Pharmacology
Medical/Pharmacy Students
Signal Transduction & Downstream Effects
Ion Channel-Linked Receptors
Direct ion flow on binding.
Fast response (milliseconds)
nAChR, GABA-A
Membrane depolarization / hyperpolarization
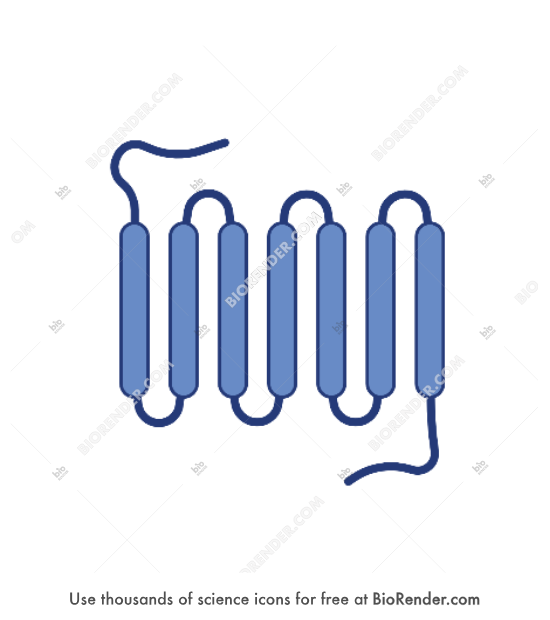
G-Protein Coupled Receptors (GPCRs)
Most common receptor type. Coupled to second messengers (cAMP, IP3, DAG).
Moderate speed (seconds)
Adrenergic, muscarinic receptors
Activation of downstream paths
Enzyme-Linked Receptors
Tyrosine kinase activity on binding.
Slower response (minutes-hours)
Insulin receptor, growth factor receptors
Gene expression changes
Drug
Receptor Binding
Signal Transduction
Second Messenger
Effector Protein
Biological Effect
Drug Tolerance & Desensitization
Tolerance
Decreased response to a drug over time with repeated exposure
Requires increasing doses to achieve the same effect
Types: Pharmacokinetic (metabolic), Pharmacodynamic (receptor-level)
Opioid tolerance, alcohol tolerance, nitrate tolerance
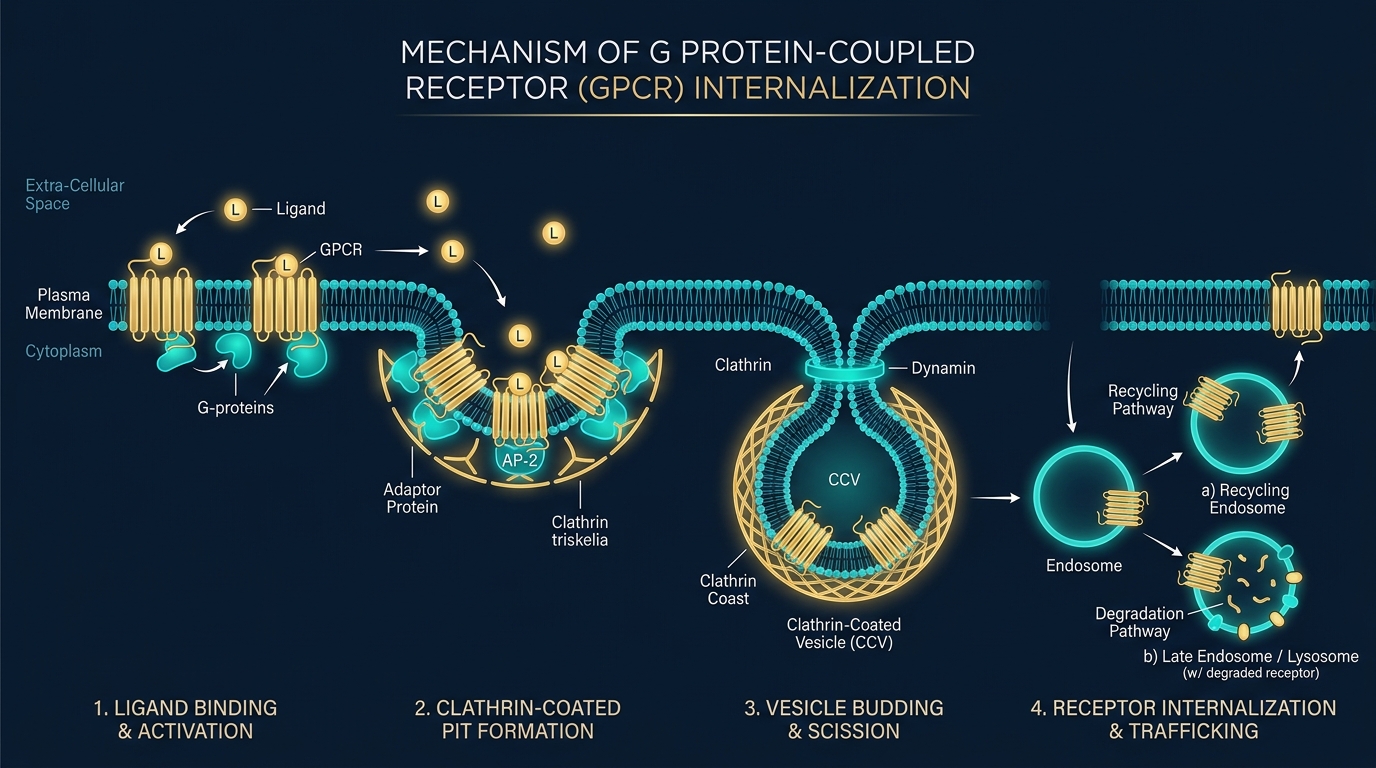
Receptor Desensitization
Loss of receptor responsiveness despite continued drug presence
Mechanisms: receptor phosphorylation, internalization, uncoupling from G-protein
Tachyphylaxis: rapid onset desensitization
Beta-adrenergic receptor desensitization with prolonged β-agonist use
Key Takeaways
🔬 Drug effects are quantified through dose-response relationships
📈 Graded DRCs measure magnitude; Quantal DRCs measure population response
🎯 EC50 reflects potency; Emax reflects efficacy
⚖️ Therapeutic Index = TD50/ED50 — key safety measure
🔗 Competitive antagonism shifts DRC right; non-competitive reduces Emax
💊 Spare receptors allow maximal effect with partial receptor occupancy
🔄 Tolerance/desensitization reduce drug response over time
🧬 Signal transduction links receptor binding to biological effects
Understanding receptor quantitation is fundamental to rational drug design and clinical pharmacotherapy.
Department of Pharmacology
Thank You
- pharmacology
- pharmacodynamics
- dose-response-curve
- receptor-theory
- agonists-antagonists
- medical-education
- drug-efficacy