Retail Sales Analytics: Data-Driven Insights & Strategy
Explore retail performance analytics covering sales, profit trends, regional performance, and strategic recommendations for category-level growth.
ADM1370_W26_A02_Group#_PPT
Retail Sales Analytics: Insights & Recommendations
Group Members: [Name 1] | [Name 2] | [Name 3] | [Name 4]
ADM1370 – Winter 2026 | Assignment 02
Company Overview
US-Based Retail Company
Sells Products Across Multiple Categories
Operates in Different Regions Across the US
Serves Consumer, Corporate & Home Office Segments
Focus on Sales, Profit & Customer Behavior
Dataset Overview
Multi-Year Transactional Dataset
Used to analyze performance and trends across the US retail landscape
Sales
Profit
Discount
Category & Sub-Category
Region
Customer Segment
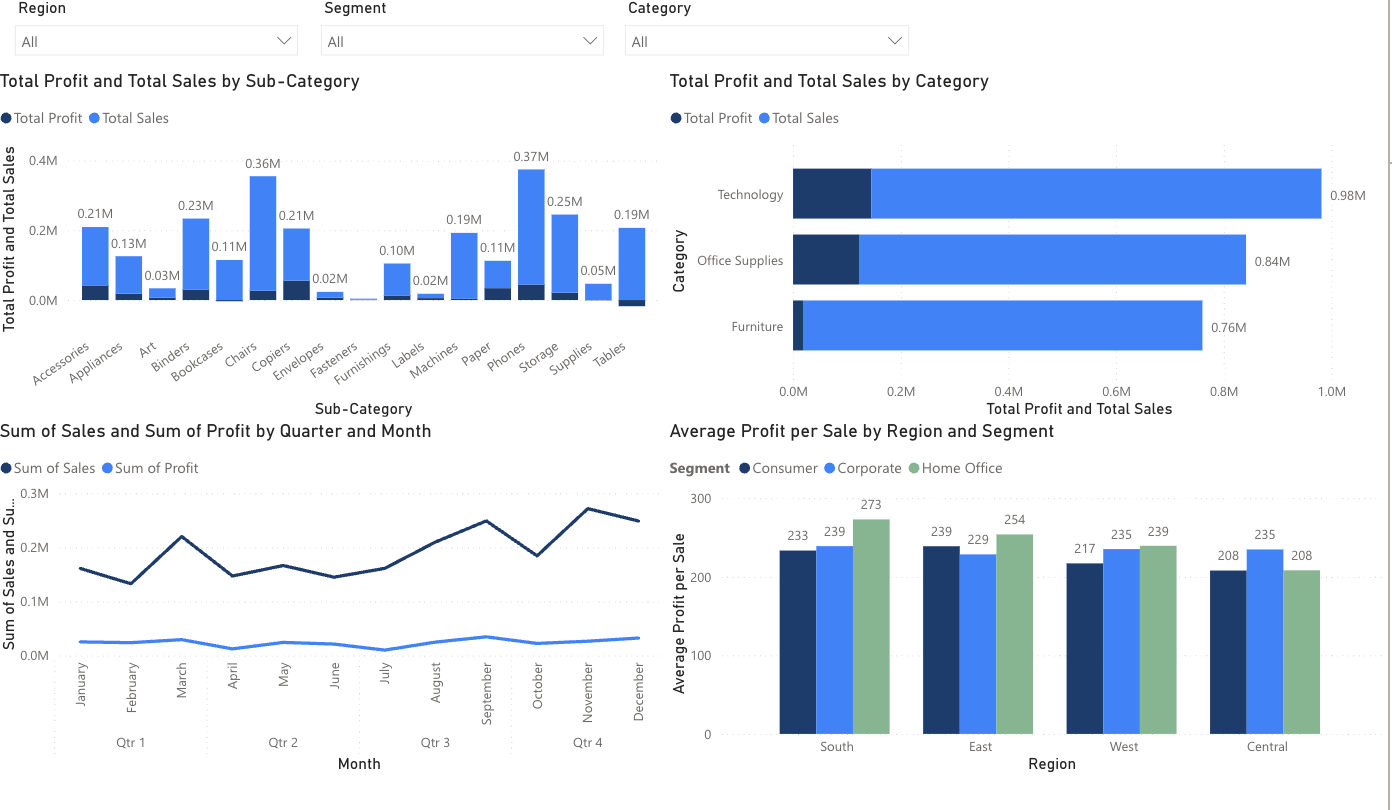
Product Performance Overview
Sales vary significantly across sub-categories
A small number of products drive most revenue
Many sub-categories contribute very little
Best & Worst Performing Products
TOP PERFORMERS
LOW PERFORMERS
Revenue is concentrated in a few product groups — low performers have minimal impact.
Sales & Profit Trends Over Time
Strong Q4 Performance
Sales increase steadily over time
Peak performance occurs in November (Q4)
Profit remains much lower than sales
Profit growth does not match sales growth
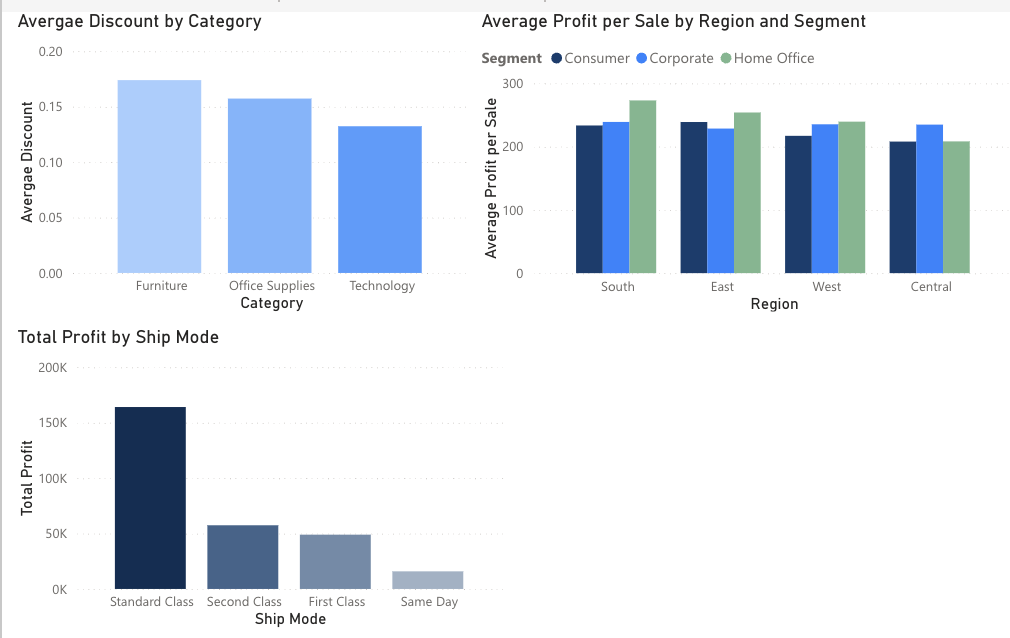
Customer Segment Profitability
Average Profit per Sale by Region & Segment
Home Office Peaks
Home Office segment has highest profit per sale (273 in South region).
Regional Leader
South region leads in average profit.
Central Lags Behind
Central region performs weakest (208).
Highly Profitable
Home Office customers are more profitable per transaction.
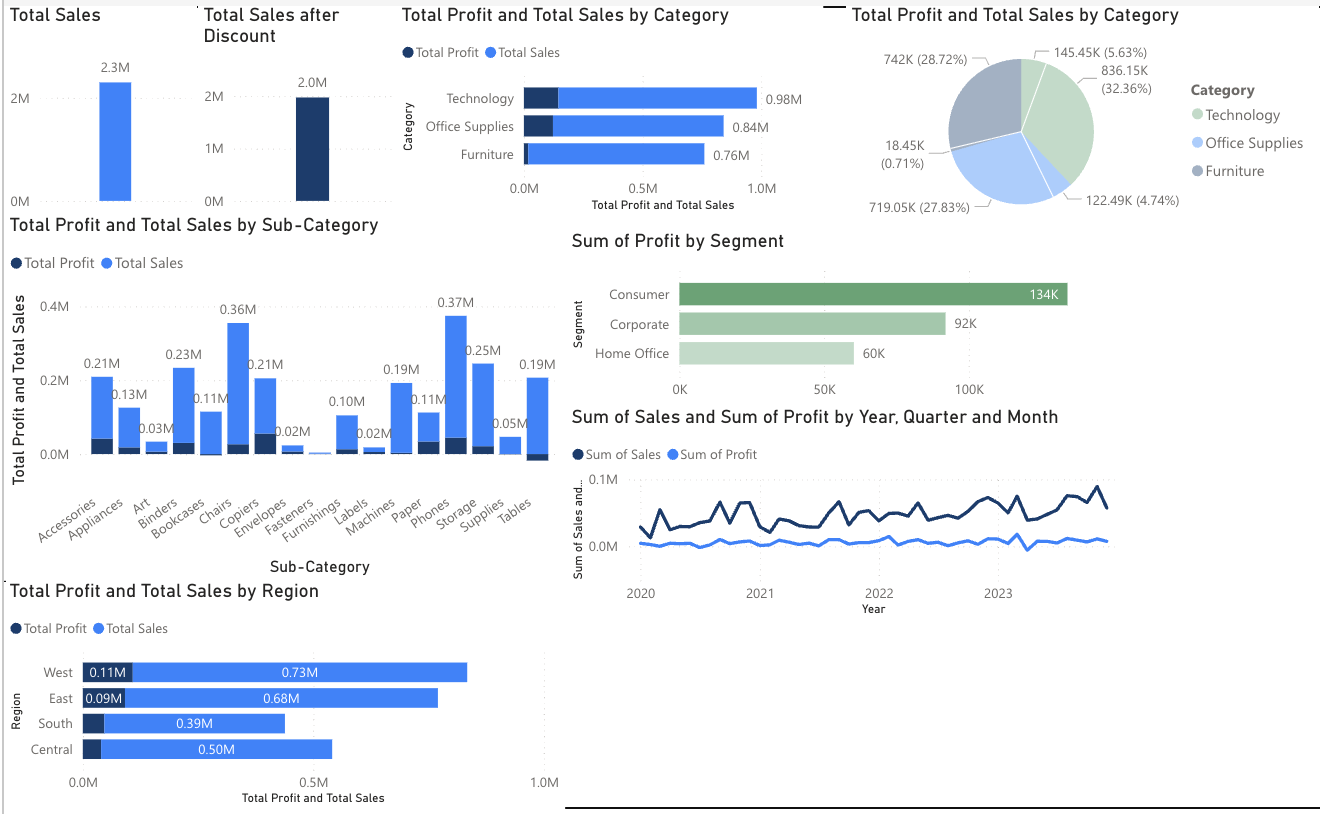
Regional Sales Performance
$0.73M Sales
$0.11M Profit
$0.68M Sales
$0.09M Profit
$0.50M Sales
(low profit)
$0.39M Sales
Some regions are underperforming despite sales — Central region consistently lowest in profit margins.
KPI 1
KPI 1 – Category Performance
Technology
$0.98M
Office Supplies
$0.84M
Furniture
$0.76M
Technology drives the most revenue — Furniture underperforms relative to other categories.
KPI 2
Sales vs. Profit
High Sales ≠ High Profit
Some products have high sales but low profit
Profit does not scale with sales volume
Margins vary significantly across products
Discounts or costs may be too high in some categories
Furniture has highest avg. discount (17%) — linked to low profit margins.
KPI 3
Monthly Sales Trends
Sales increase toward end of year (Q4 peak)
Lowest performance observed mid-year (June–July)
Strong seasonal pattern every year
Business heavily depends on Q4 performance
Seasonality Risk:
Over-reliance on Q4 could be a business vulnerability.
Profitability Trend & Explanation
The Trend
Sales increase over time but profit stays relatively flat
Possible Reasons
High discount usage across categories
Rising operational and shipping costs
Low-margin products dominating sales mix
Additional Data Needed
Detailed discount levels by product
Product cost and COGS data
Marketing spend by category
Dashboard Overview
Category & Sub-Category Analysis
Region Performance View
Time Series Trends
Segment Profitability
Filters available: Region | Segment | Category — enabling drill-down analysis.
Dashboard Link: [Insert URL here]
Key Insights
Technology is the Main Revenue Driver
$0.98M in sales
Home Office Segment is Most Profitable
Highest avg. profit per sale
South Region Performs Best
Highest profit per segment
Sales Peak in Q4
November shows strongest performance
Profit Margins Are Inconsistent
Sales growth outpaces profit growth
14
Recommendations & Conclusion
Focus on High-Margin Segments
prioritize Home Office and Corporate customers
Reduce Discounts on Low-Profit Products
especially in Furniture category
Improve Central Region Performance
targeted sales and marketing initiatives
Invest More in Q4 Campaigns
capitalize on seasonal demand peak
Review Pricing Strategy
align pricing with actual cost and margin data
By acting on these insights, the company can improve profitability and sustain long-term growth.
- retail-analytics
- sales-performance
- profitability-analysis
- data-driven-strategy
- business-insights
- market-segmentation
- kpi-dashboard