


E. coli DNA Replication: Titration and Switch Models
Explore how E. coli controls DNA replication through DnaA titration and the ATP/ADP regulatory switch to ensure precise once-per-cycle division.
Mechanisms of DNA Replication Initiation Control in E. coli
In vivo evidence for the cooperation of the Titration Model and the Regulatory Switch
Introduction: The Timing Problem
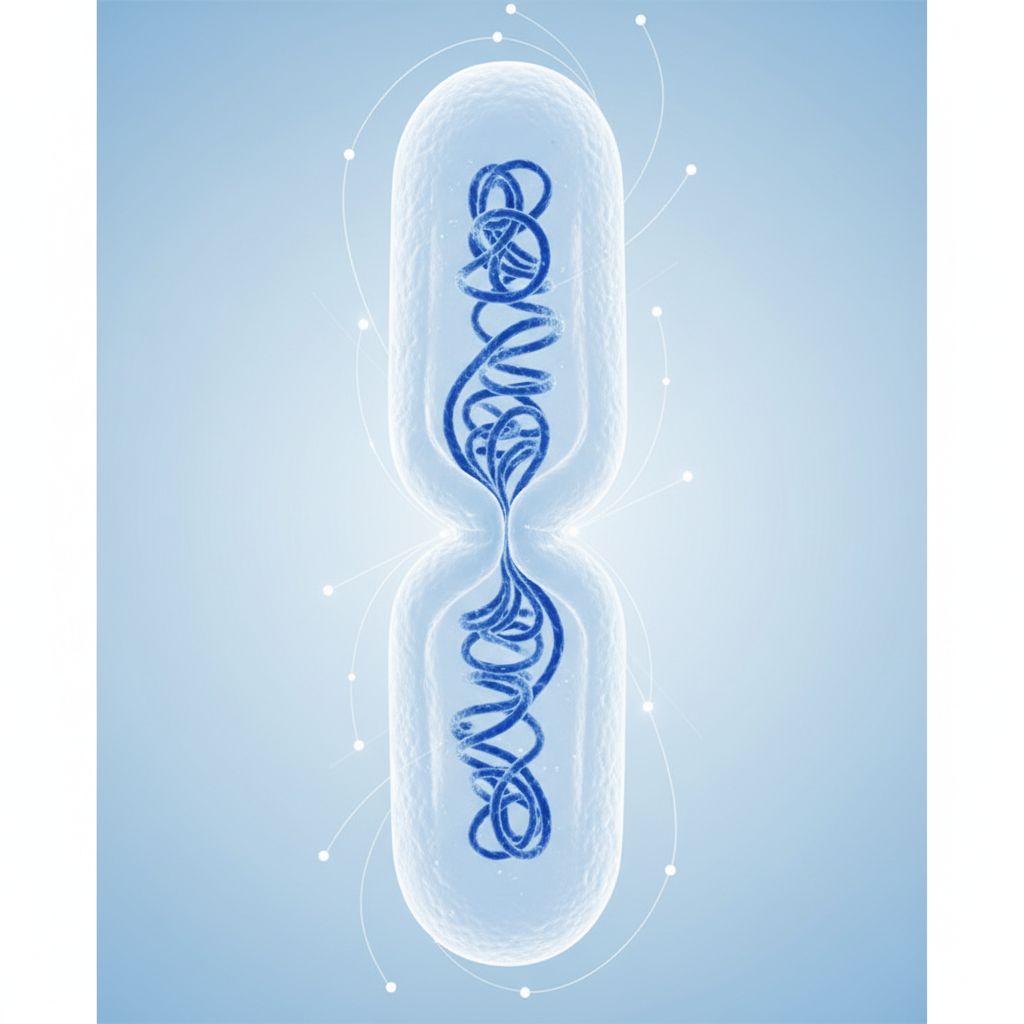
E. coli must copy its DNA exactly once per cycle.
Mistakes are costly: Too early = too much DNA; Too late = bad division.
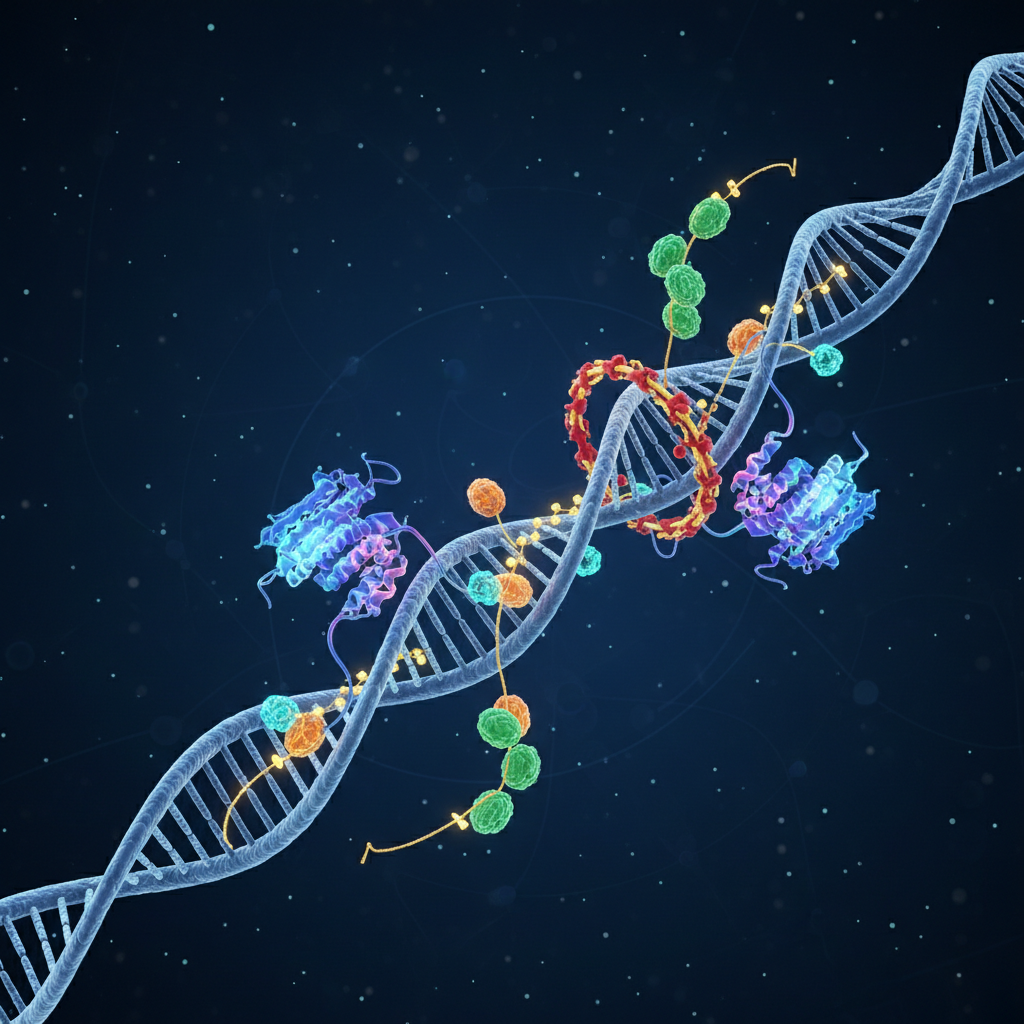
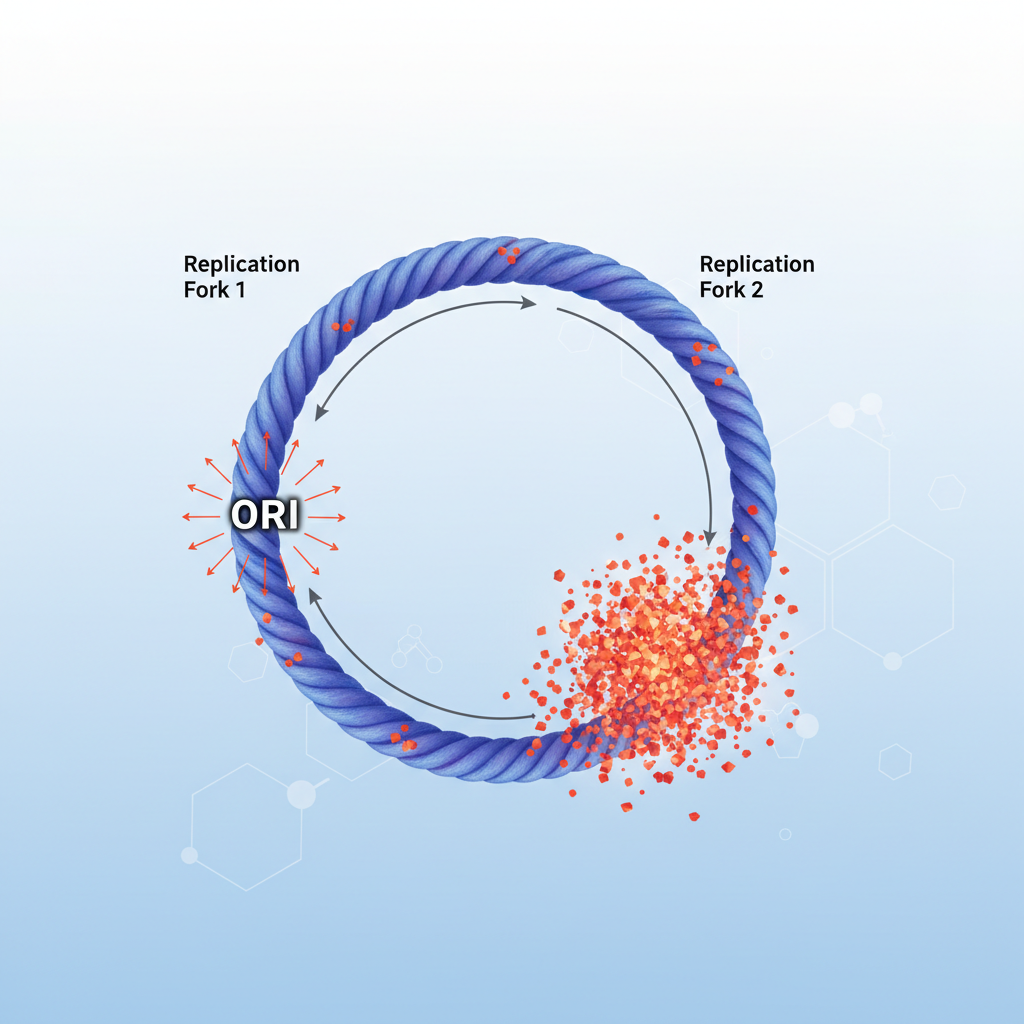
Key Protein: DnaA starts the process at the origin (oriC).
Today I will present a paper that investigates how E. coli controls the initiation of DNA replication, focusing on the key initiator protein DnaA.
Correct timing of DNA replication is essential for bacteria. If replication starts too early or too often, cells get too many chromosomes. If it starts too late, cells divide incorrectly.
The central protein that controls the start of replication in E. coli is DnaA, which binds the origin of replication, oriC, and unwinds DNA to begin replication. But for decades, scientists didn’t fully understand how the cell prevents DnaA from starting replication multiple times within one cell cycle.
The Puzzle: How does the cell confirm it's safe to start?
Two Historic Models of Regulation
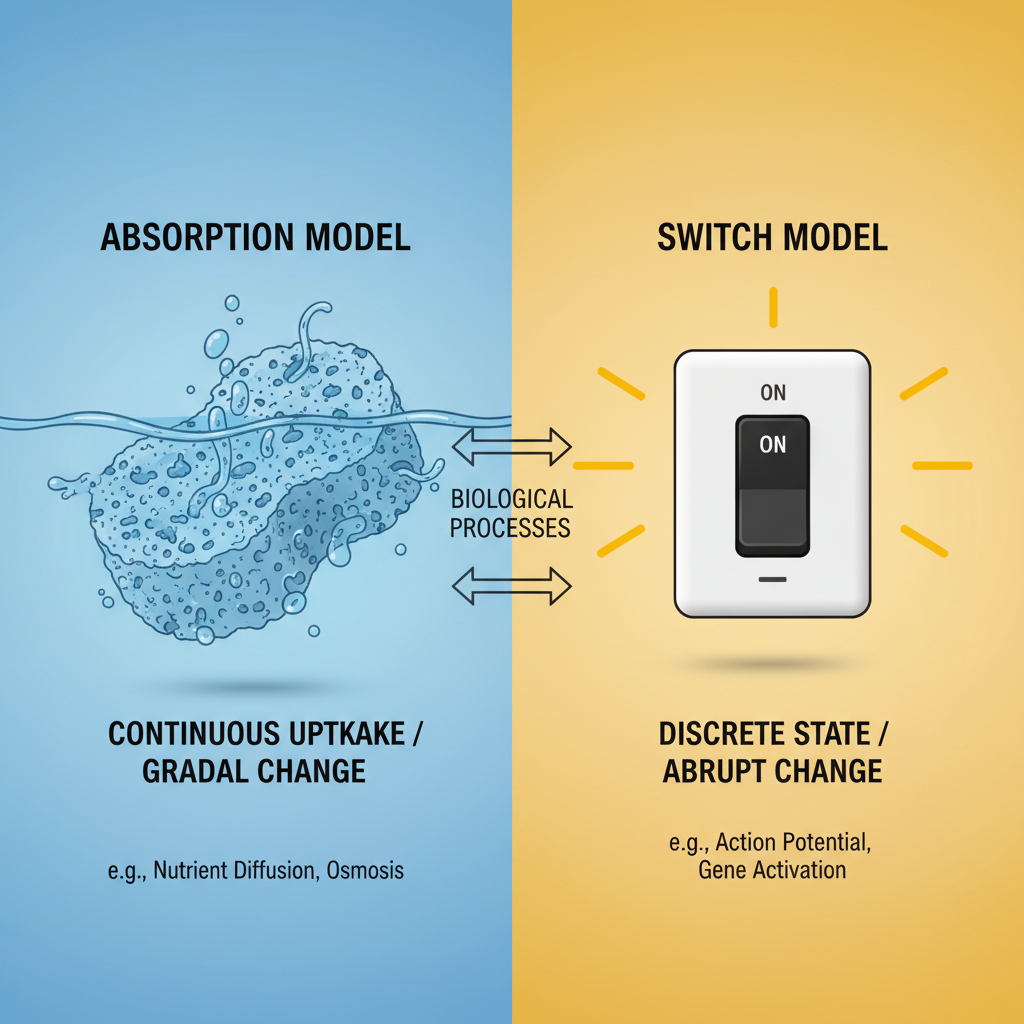
1. The Initiator Titration Model
DnaA molecules get "soaked up" or titrated by hundreds of DnaA-binding sites—called DnaA boxes—spread along the chromosome. Only when these boxes are saturated is enough free DnaA available to activate oriC.
2. The Switch Model
DnaA switches between ATP-bound (active) and ADP-bound (inactive) forms. The balance between these two forms controls initiation.
Although both models are widely accepted, the titration model has never been directly proven experimentally since it was proposed more than 40 years ago. This study is the first to directly measure the binding state and mobility of individual DnaA molecules in living E. coli cells. Its goal is to determine whether titration really happens, how strong it is, and how it interacts with the ATP/ADP switching system.
Two Competing Models
Key Questions of the Study
Are DnaA boxes distributed in a way that supports titration?
Does DnaA actually get titrated in living cells, and does this depend on growth rate?
How do important regulatory DNA regions—datA, DARS1, and DARS2—affect titration?
Does titration influence DnaA’s secondary role as a transcription factor?
Key Questions
Methodology: Visualizing Molecules in Live Cells
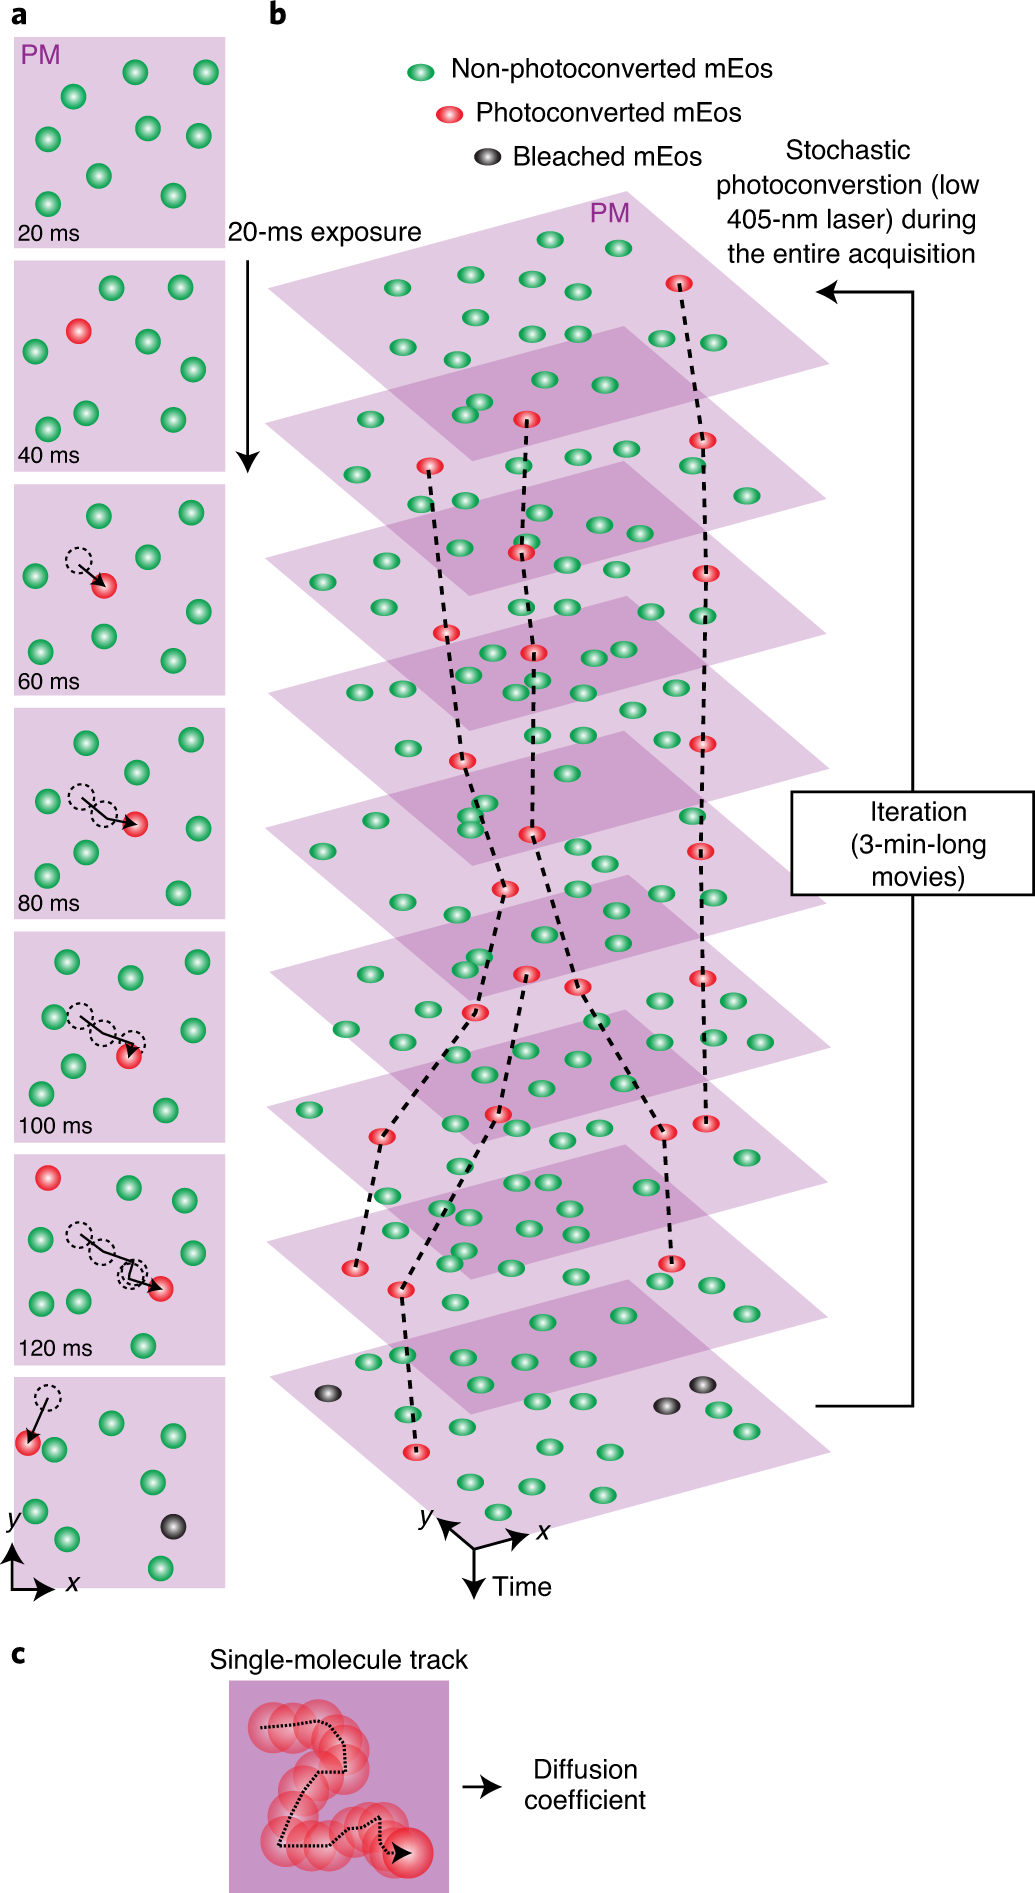
sptPALM (Single Particle Tracking Photoactivatable Localization Microscopy)
Construct: PAmCherry fused to DnaA (replacing aa 87–106).
Capability: Distinguish free DnaA (fast diffusion) vs. DNA-bound DnaA (slow diffusion).
3.1 Mapping DnaA boxes
They scanned the genome to count and locate all high- and low-affinity DnaA boxes. They also analyzed dozens of E. coli strains to see if the pattern is conserved.
3.2 Visualizing individual DnaA molecules in live cells
They fused PAmCherry, a photoactivatable fluorescent protein, into the DnaA sequence, replacing amino acids 87–106. This allowed real-time visualization of single DnaA molecules in living E. coli cells.
They used sptPALM (Single Particle Tracking Photoactivatable Localization Microscopy). This technique tracks thousands of individual molecules and measures if DnaA is free (fast diffusion) or bound to DNA (slow diffusion). They did this under slow, intermediate, and fast growth.
Methods: Seeing the Invisible
Methodology: Genetic Analysis & Mutants
3. Mapping DnaA Boxes Scanning the genome for high- and low-affinity binding sites across 50+ E. coli strains and Salmonella.
4. The Deletion Strains Creation of ΔdatA, ΔDARS1, ΔDARS2 single mutants and the triple mutant (Δ3D). Goal: Remove nucleotide state regulation (ATP/ADP switch) to isolate the effect of titration.
3.3 Mutant strains
They created: A triple deletion strain (ΔdatA ΔDARS1 ΔDARS2) and single deletions (ΔdatA, ΔDARS1, ΔDARS2). Because these loci control the ATP/ADP state of DnaA, deleting them changes how active DnaA is. This lets the authors test whether titration depends on the nucleotide state of DnaA.
3.4 Cell physiology measurements
They also measured: DNA content (via flow cytometry), Cell size, and Protein levels (proteomics).
Methods: Breaking the System
Result 1: DnaA Boxes Accumulate Near oriC
The genome is not random. There is a dense functional clustering of DnaA boxes specifically around the origin of replication.
Biological Implication:
Since the oriC region is replicated first, the cell doubles its titration capacity almost immediately. This allows the chromosome to rapidly sequester DnaA and prevent re-initiation events.
The chromosome does not have a random distribution of DnaA boxes. Instead, the authors found a dense clustering of DnaA boxes around the origin (oriC). This means it is likely functionally important and evolutionarily conserved.
E. coli MG1655, 56 different E. coli strains, and even in Salmonella.
When replication starts, the region around oriC is replicated first, so the cell rapidly generates new titration sites (new DnaA boxes) immediately after initiation. This supports the idea that the chromosome is optimized to pull DnaA away after each initiation event and prevent immediate re-initiation.
Result 1: The "Sponge" Zone
Result 2: Titration is Real and Growth-Dependent
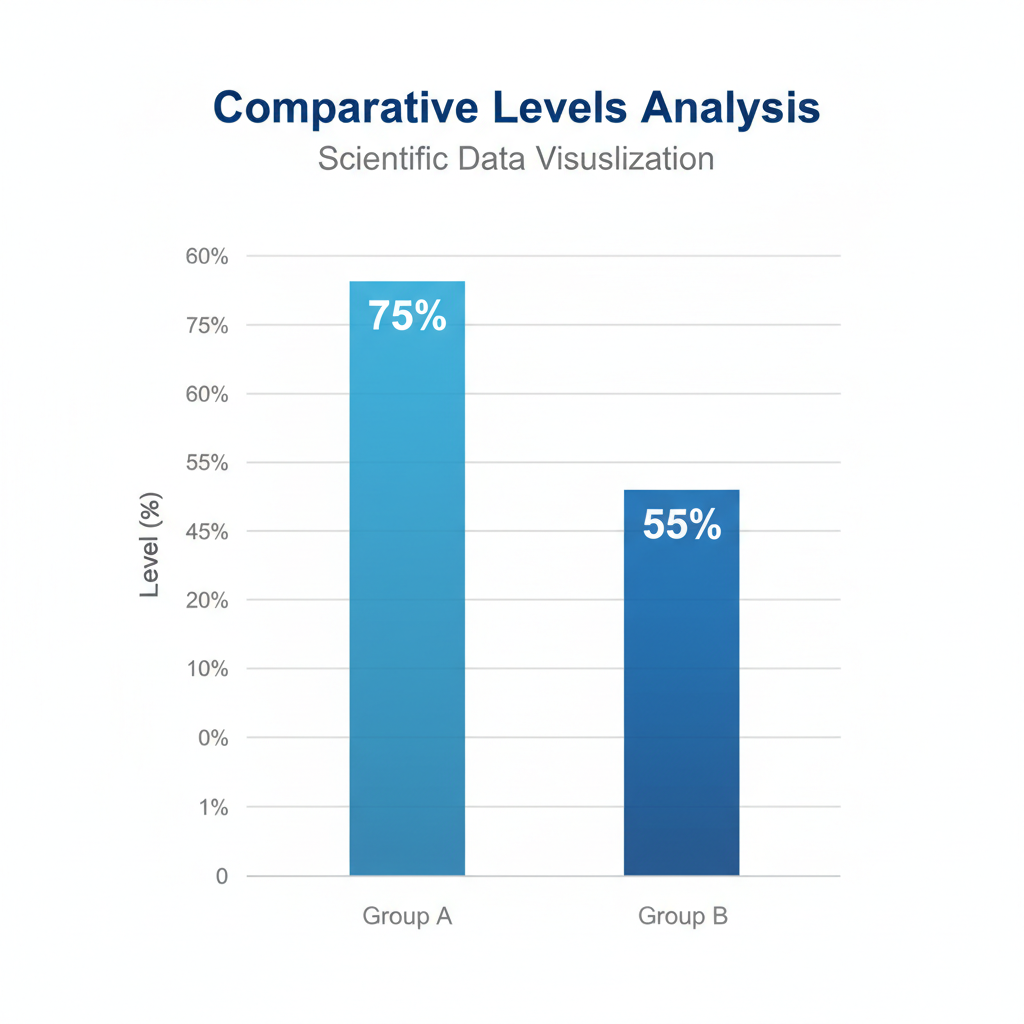
sptPALM data reveals the percentage of DnaA bound to the chromosome decreases as growth limits titration capacity.
CRITICAL FINDING: Even in fast growth, >50% of DnaA is titrated. However, faster protein production outpaces the creation of new DNA binding sites, weakening the titration effect.
From sptPALM data, they measured how much of DnaA is bound to DNA. They found that titration levels vary with growth conditions:
Why does titration decrease with faster growth? During fast growth, the cell produces DnaA much faster. But replication fork speed is constant → new DnaA boxes appear at the same rate. Result: too much DnaA, too few new titration sites → titration becomes weaker.
Even so, more than half of DnaA is still DNA-bound in all conditions. This provides the first real experimental evidence that the chromosome titrates DnaA.
Result 2: Measuring the Balance
Result 3: The Δ3D Strain (System Breakdown)
The Experiment: Removed datA, DARS1, and DARS2 (Δ3D). Effect: DnaA is no longer switched between active/inactive states properly, AND important titration helper sites are lost.
The Outcome: Cells initiate replication too often ('runaway' initiation). Conclusion: Titration alone is not enough; the regulatory sites (datA/DARS) are necessary for correct timing, especially during slow growth.
The authors next tested what happens when the normal control of DnaA is removed. They created a strain called Δ3D, which means that three regulatory DNA regions — datA, DARS1, and DARS2 — are deleted.
In these cells, DNA replication starts too often, especially during slow growth. The cells contain too much DNA and too many replication origins, which shows that the system that normally prevents re-initiation is no longer working.
This happens because datA, DARS1, and DARS2 normally control how active DnaA is and how it interacts with the chromosome. When all three are missing, DnaA is no longer properly switched between its active and inactive forms, and at the same time important binding regions for DnaA are lost.
Result 3: Losing Control
Result 4: Specificity of Control
DnaA is not just a replicator; it is also a transcription factor that regulates gene expression.
Does heavy titration prevent DnaA from doing its job regulating genes?
NO. Even when titration models are disturbed, the expression of DnaA-regulated genes remains stable.
Titration specifically targets replication initiation, acting as a buffer for the Origin, without disrupting general cell physiology.
DnaA also acts as a transcription factor, so the authors asked whether titration affects gene regulation. They found that even when titration is strongly disturbed, the expression of DnaA-regulated genes does not change. This means that titration specifically controls replication initiation, not transcription.
Result 4: Targeted Action
Conclusion: A Cooperative Mechanism
This study solves the decades-old missing link in understanding DNA replication control.
QUANTITY CONTROL (Titration): The chromosome acts as a giant sponge, sequestering excess DnaA.
QUALITY CONTROL (Switch): Regulatory loci (datA, DARS) control whether free DnaA is active (ATP) or inactive (ADP).
Together, they ensure distinct, once-per-cycle replication, particularly critical during slow growth conditions.
This study provides the first direct evidence that the bacterial chromosome actively titrates DnaA. By binding most DnaA molecules, the chromosome limits how much active DnaA is available to start replication.
Titration works together with the ATP/ADP switch of DnaA to ensure that replication starts at the right time and only once per cell cycle. This control is especially important during slow growth, when cells rely on a single round of replication.
Overall, the paper finally explains how E. coli achieves precise control of DNA replication initiation.
Conclusion
- dna-replication
- e-coli
- microbiology
- dnaa-protein
- molecular-biology
- genetics
- synthetic-biology