System Analysis and Design for Remote Glucose Monitoring
A comprehensive design document covering 3-tier SaaS architecture, database schemas, UML diagrams, and UI principles for a glucose monitoring system.
SA2 – System Analysis<br>and Design
Design Document
420-N42-LA Systems Analysis and Design
Bahman Zamani
Champlain College Saint-Lambert
Table of Contents
1.1 System Architecture
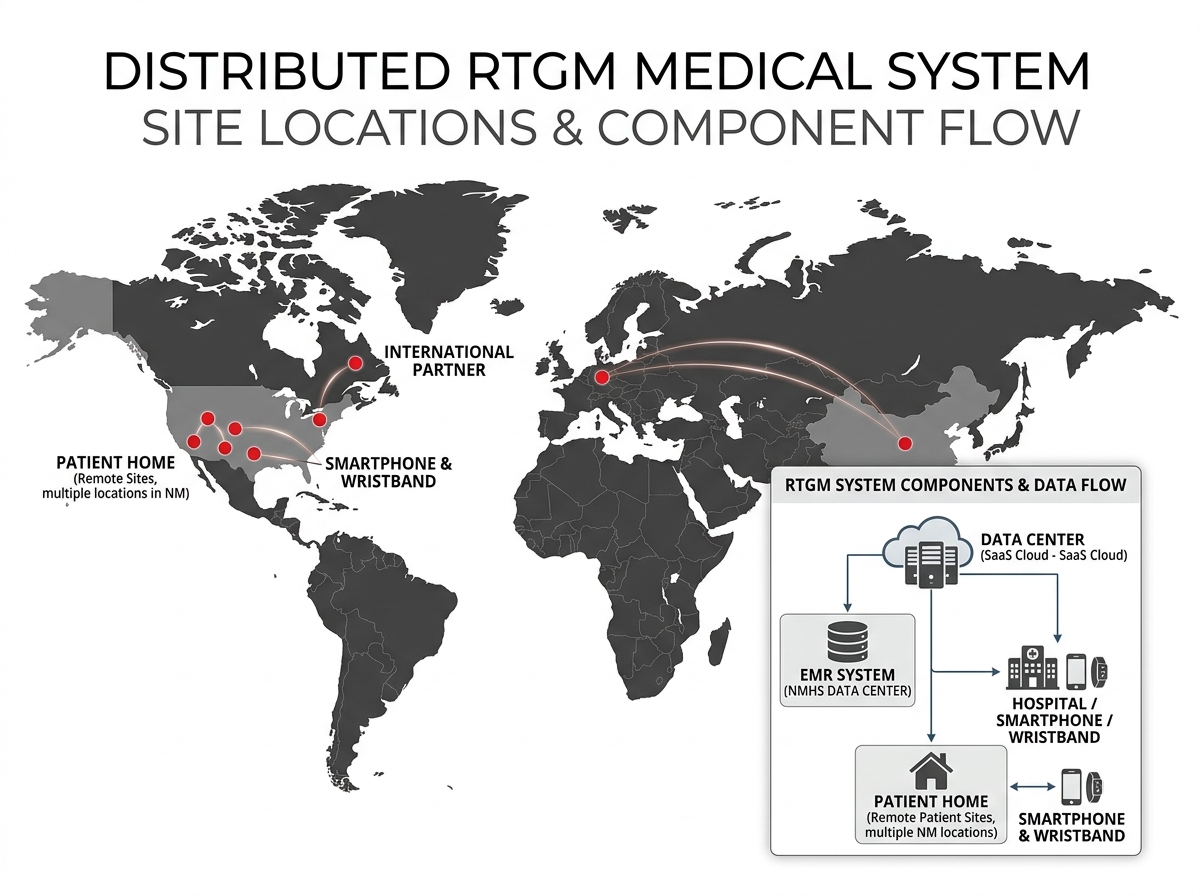
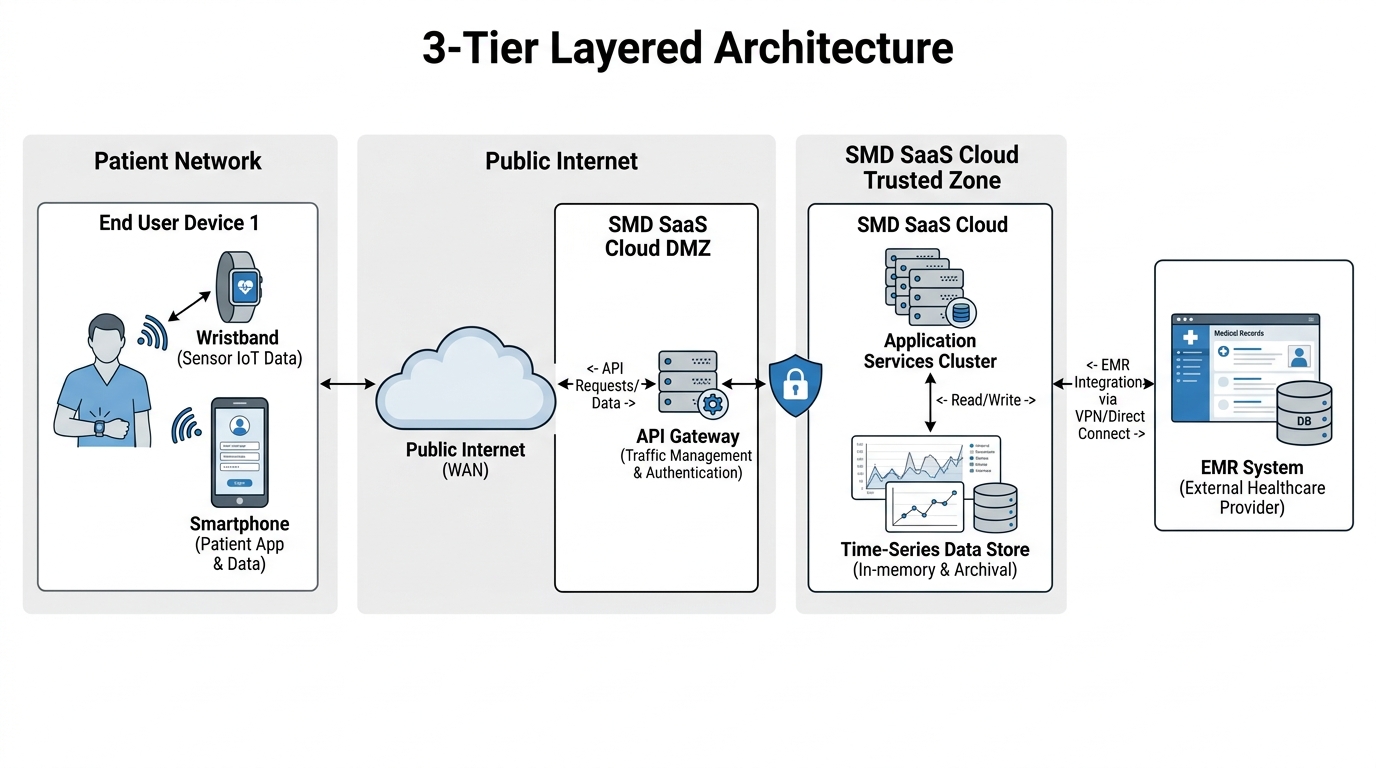
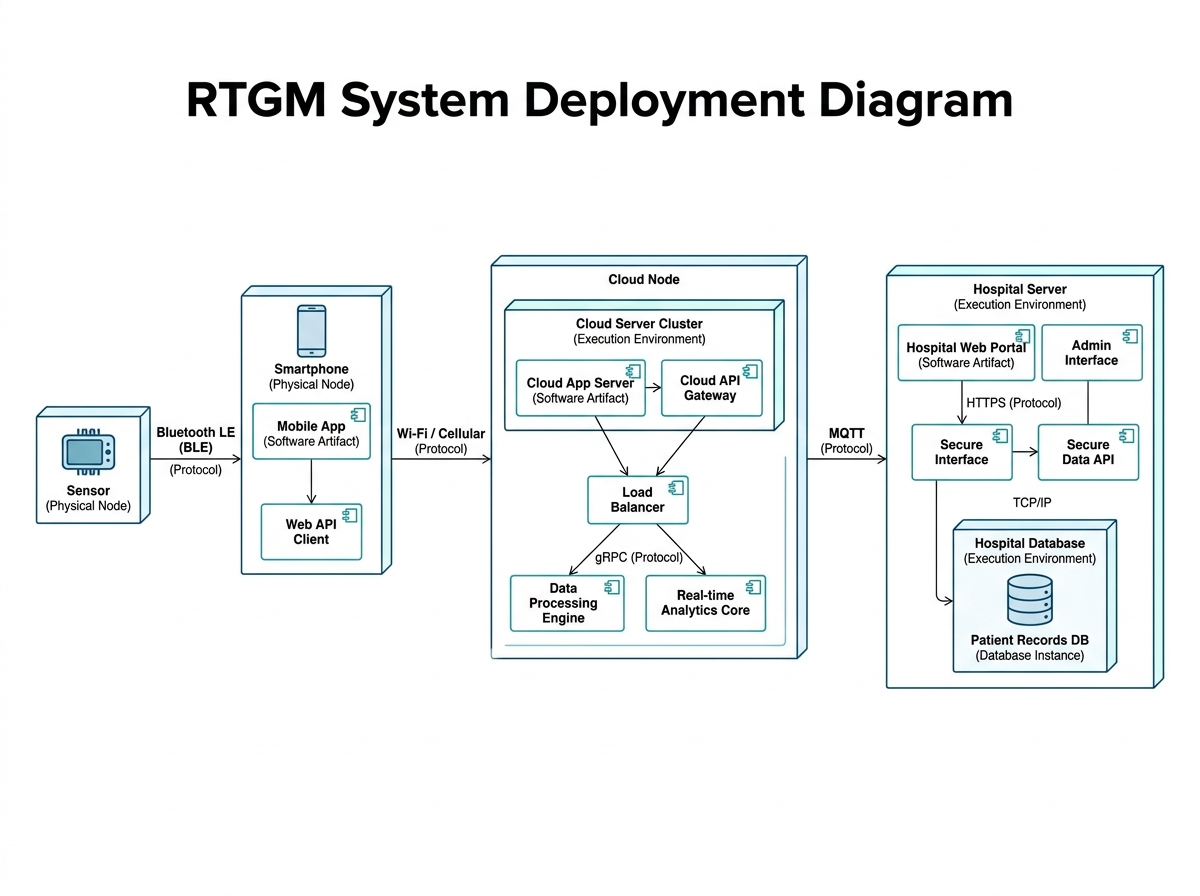
The RTGM uses a SaaS model built on a 3-tier architecture to separate the program into layers. The server uses a distributed architecture for secure processing and high-volume glucose data. Data is transferred via Bluetooth, then sent to the cloud via Wi-Fi. This setup ensures interoperability allowing patient notes and glucose trends to be integrated directly into the NMHS Electronic Medical Record (EMR).
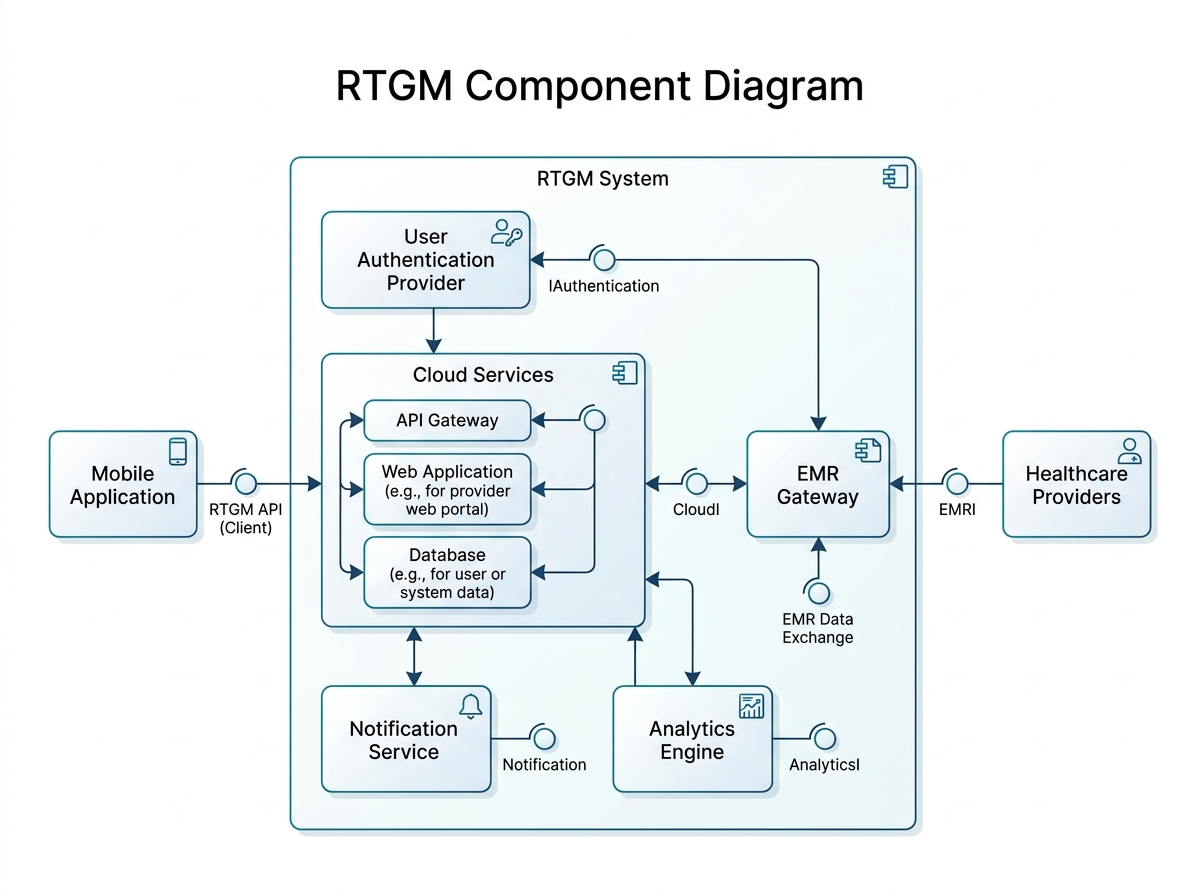
1.2 Application Components
Subsystems & Data Flow Diagram
2. User Interface Design — Design Principles
CONSISTENCY
All screens use the same colour scheme, fonts and button styles. Green = normal glucose. Red = dangerous glucose level. Simple colours ensure accessibility for all users.
DISCOVERABILITY
View glucose level, view history, and logging a note are always visible on screen. Users never need to search for core features.
FEEDBACK
Every action produces a visible response. When a nurse or physician logs a message, a pop-up confirms the message was saved successfully.
ACCESSIBILITY
Minimum font size, high contrast colours. Icons and text labels always accompany colour indicators to support users with disabilities.
2.3 Design Considerations
USABILITY
The design is very simple. For dietary tracking the app presents large, clearly identified buttons. The Dashboard keeps the glucose graph and 'View Full History' button on the same screen — key actions are one tap away.
READABILITY
Each screen focuses on only one aspect at a time. Large text and full charts make glucose data easy to read, even for people with disabilities. Pressing a button takes you to the next page.
NAVIGATION EASE
All screens share the same button and navigation style. Users always know where they are and where they can go.
3.1 Relational Database Schema — Design Steps
Create the Tables
Choose Primary Keys
Add Foreign Keys
Many-to-Many Tables
Classification Hierarchies
Referential Integrity
Evaluate Schema Quality
Choose Data Types
Integrity & Security Controls
Patient
WristbandDevice
GlucoseReading
Alert
Amendment
VoiceMessage
Note
HealthcareProvider
ResponseAction
ElectronicMedicalRecord
PatientHistory
3.1 Database Schema — Data Types & Integrity Controls
3.2 & 3.3 Database Security and Protection
Homogenous architecture — all NMHS sites use the same technology for consistency and easier maintenance.
TRANSACTION LOGGING
Every query to the database is logged. If a system failure occurs, the database can return to a previous state ensuring no patient data is lost.
CONCURRENCY CONTROLS
Prevents two healthcare providers from updating the same patient record simultaneously. Transactions queue to maintain data integrity.
DATA ADMINISTRATORS
Control access to records by role: Nurses view only assigned patients. Physicians see only high-risk records. Patients access only their own data.
DATABASE ADMINISTRATORS
Responsible for database backups to prevent data loss. Maintain the database to ensure it always functions correctly.
4. Design Class
Diagram
RTGM System
System Analysis and Design
5. Design Sequence Diagram
Enter Text Note / Record Voice Message
5. Design Sequence Diagram: View Glucose Trends
6. Design Principles
01
Object Responsibility
Mobile side handles visualization, data acquisition & user input. Cloud side manages glucose analysis, alerts, history & EMR integration. Each component has one clear job.
02
Separation Of Concerns
3-tier architecture divides the system: View layer (UI), Business Logic layer (cloud services), Data Access layer (database). Easier to test and maintain.
03
Indirection
Services act as intermediaries between mobile app, cloud, and EMR. Components don't communicate directly, keeping the system flexible and decoupled.
04
Cohesion
Each part focuses on one purpose. UI screens handle single tasks. Database entities each represent one clear concept: Patient, GlucoseReading, Alert, etc.
05
Coupling
Low coupling by separating interface, logic, and storage. Mobile app doesn't manage cloud or database logic. Changes in one layer don't force changes in others.
AI Disclosure
MODELS USED
<div style="display: flex; flex-direction: column; gap: 20px;"> <div style="display: flex; align-items: flex-start;"> <div style="color: #00E5FF; font-size: 34px; line-height: 0.8; margin-right: 18px; margin-top: 4px;">•</div> <div><strong style="color: white; font-weight: 600;">Gemini</strong> — Used for Task 1</div> </div> <div style="display: flex; align-items: flex-start;"> <div style="color: #00E5FF; font-size: 34px; line-height: 0.8; margin-right: 18px; margin-top: 4px;">•</div> <div><strong style="color: white; font-weight: 600;">ChatGPT</strong> — Used for Task 2</div> </div> </div>
TASK 1 PURPOSE
AI was used to recall concepts such as how to create UML diagrams with PlantUML. Also used to review work and verify completeness and correctness.
TASK 2 PURPOSE
AI helped with the Database Design process — ensuring tables were complete, well-structured, and close to perfection with all required attributes.
WHAT WE LEARNED
Using AI as a review and reference tool improves efficiency. AI assisted in ensuring completeness of diagrams and database steps while the team made all final design decisions.
- system-analysis
- software-design
- saas-architecture
- database-schema
- uml-diagrams
- healthcare-technology