


Madrid-Barajas Airport International Traffic Forecast 2035
Expert analysis of international traffic at Adolfo Suárez Madrid-Barajas Airport, featuring GDP-based growth scenarios and infrastructure capacity planning.
Traffic Forecasts
Adolfo Suárez Madrid-Barajas Airport
International Segment · 2025–2035
PRESENTED BY:
David Palacios de Andrés & Erik López Navarrete
Module 3 – IPA (Airport Planning & Assessment)
April 2026
Introduction & Methodology
This analysis focuses exclusively on the international segment of Adolfo Suárez Madrid-Barajas Airport, using official traffic and economic data spanning over two decades.
AENA
Official international traffic data for Madrid-Barajas Airport
World Bank
GDP per capita data (income per capita) as economic indicator
Analysis Period
Data collected between 2004 and 2025 — 21 years of historical records
03
Forecasting Model
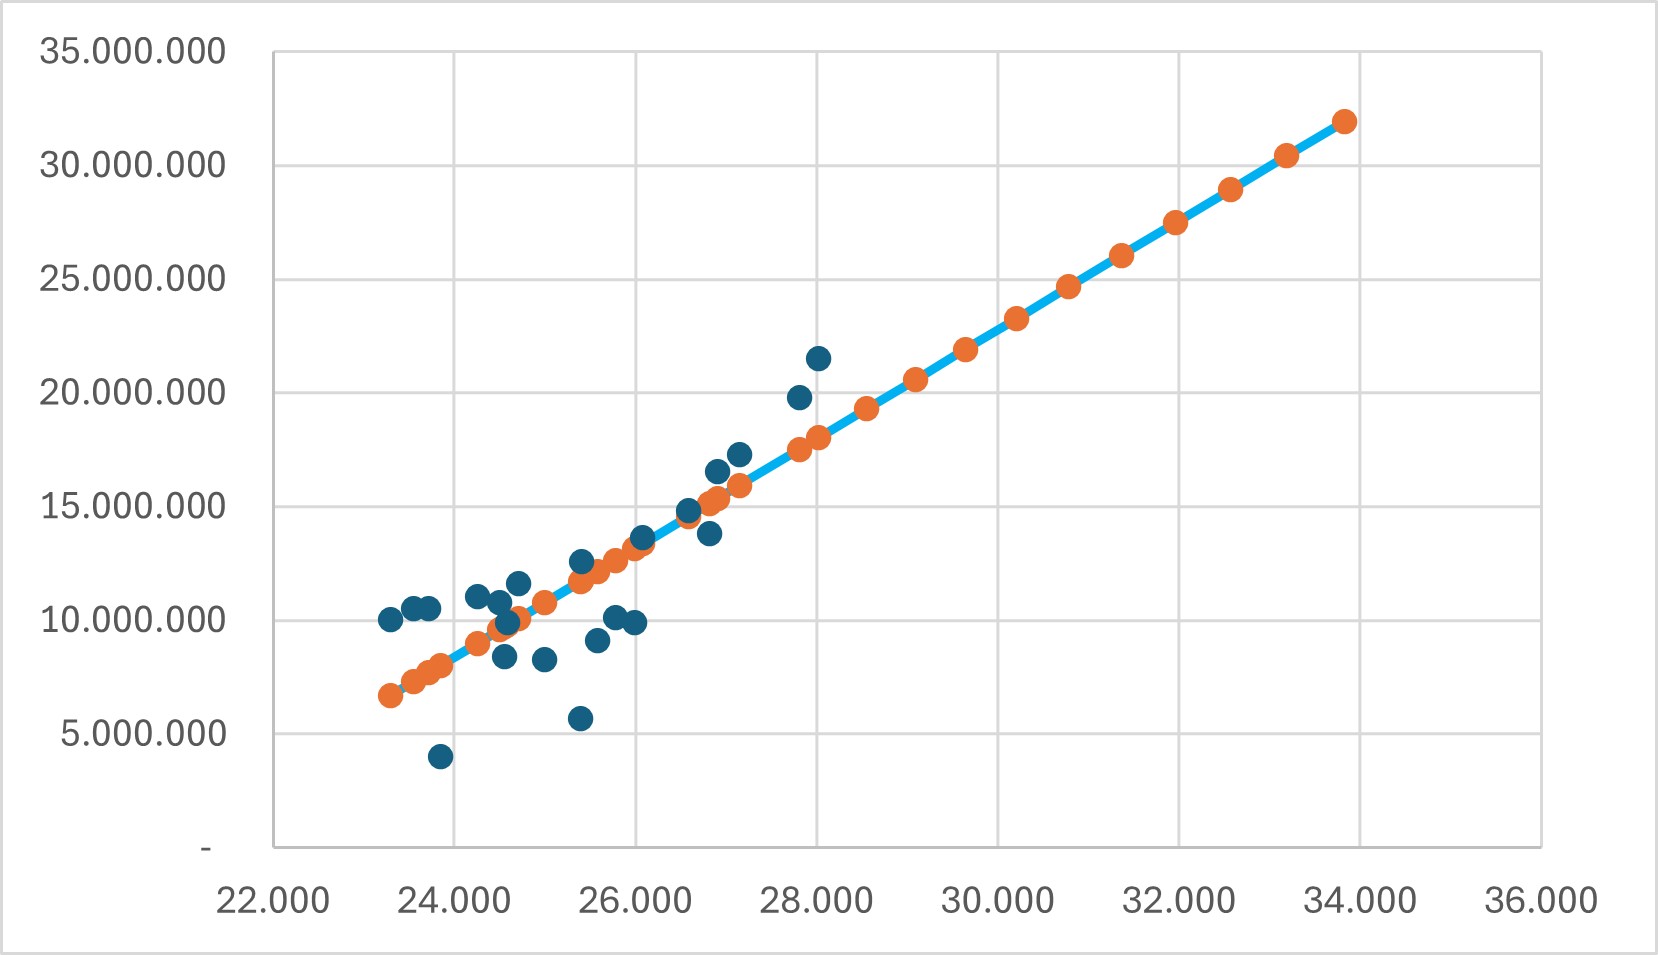
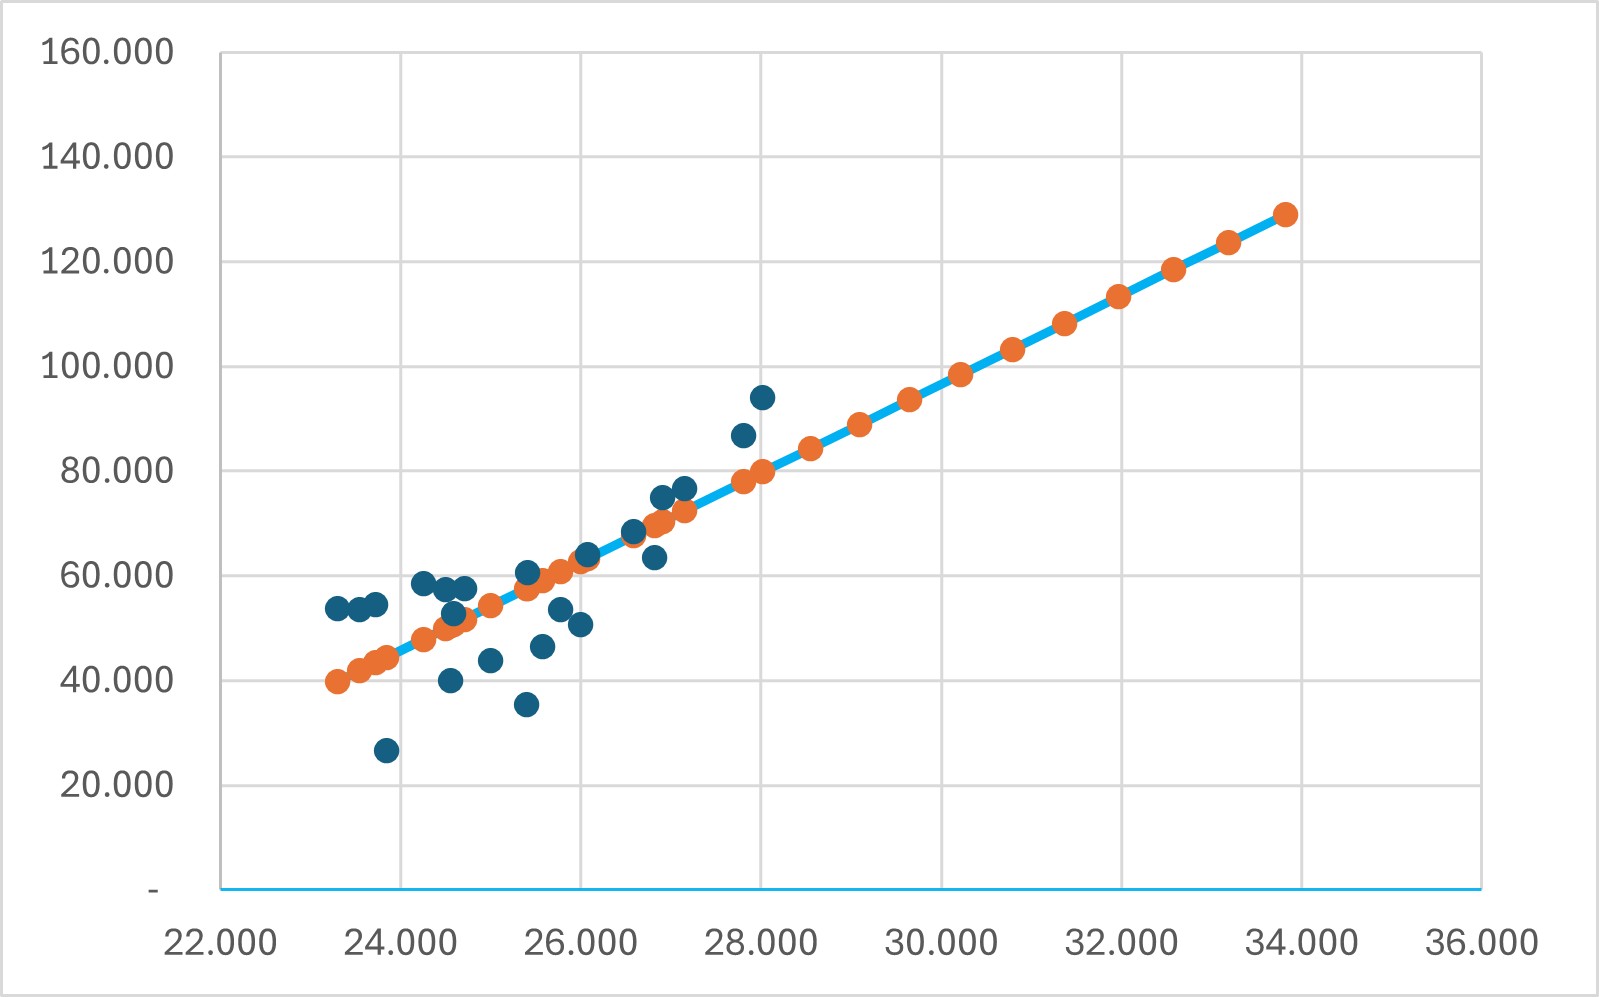
Forecasting Model – Scatter Plot Analysis
Annual Operations vs. GDP per Capita
Annual Passengers vs. GDP per Capita
🔧 Tool: Microsoft Excel
📐 Method: Least Squares Regression
📊 Axes: GDP per Capita (X) vs. Passengers/Operations (Y)
04
Future Scenarios (2025–2035)
Based on projected annual GDP growth of 1.9% over the next 10 years
World Bank: 1.7–2.0%
European Central Bank
IMF World Economic Outlook
Optimistic Scenario
Uninterrupted growth following the GDP-traffic regression trend with no additional constraints. Maximum infrastructure utilization projected.
No additional restrictions
Pessimistic Scenario
Growth conditioned on 2025 actual data aligning with forecasts. More conservative infrastructure dimensioning.
Data-validated constraint
GDP growth rate of 1.9% p.a. validated against World Bank, ECB, and Eurostat projections (range: 1.7%–2.0%)
Design Day Analysis – Busy Day
IATA DEFINITION:
The Busy Day is the second busiest day of an average week in the peak month — used to size airport infrastructure without over-dimensioning for exceptional events.
IATA Busy Day Criterion
2nd busiest day of the average week in the peak month. Balances realistic demand vs. infrastructure cost.
TUESDAY
Design Day: Tuesday
Identified as the design day using pivot table analysis of historical traffic data.
Special Events Excluded
Peak days associated with special events (holidays, sporting events, etc.) are removed to avoid distorting the design parameters.
Methodology ensures dimensioning for typical high-demand periods rather than exceptional spikes
Capacity Parameters – PHP & AHP
Peak hour calculations for infrastructure dimensioning
PHP
Peak Hourly Passengers
Maximum number of passengers processed during the peak hour on the design day. Core metric for terminal dimensioning.
AHP
Peak Hourly Aircraft
Maximum number of aircraft movements during the peak hour on the design day. Core metric for airside capacity.
Equivalent Days
Constant factor maintained for Madrid-Barajas based on historical traffic patterns.
Equivalent Hours
Normalizing factor applied to peak hour calculations across all analysis years.
Design Horizon
All parameters projected to 2035 for terminal and airside infrastructure planning.
Fleet Analysis & Aircraft Categories
International segment favors large-capacity wide-body aircraft
241
Average passengers per aircraft
International segment average
E / F
Dominant ICAO Categories
Wide-body / Heavy aircraft
> 10
Minimum passenger filter
Aircraft with <10 pax excluded to avoid data distortion
Category E – Large wide-body (e.g. Boeing 777, A330)
Category F – Super heavy (e.g. A380, Boeing 747)
Data filter applied: aircraft with fewer than 10 passengers were excluded to ensure statistical reliability
CONCLUSIONS
Key Takeaways
Infrastructure for Large Aircraft
The international segment is dominated by wide-body aircraft (ICAO Cat. E/F), requiring infrastructure sized for an average of 241 passengers per movement.
GDP-Driven Solid Growth
Strong correlation between GDP per capita and passenger/operations volume confirms robust 1.9% annual growth trajectory for the 2025–2035 horizon.
10-Year Design Readiness
Both optimistic and pessimistic scenarios provide a solid basis for planning terminal capacity, airside infrastructure, and gate dimensioning through 2035.
David Palacios de Andrés & Erik López Navarrete · Module 3 – IPA · April 2026
Bibliographic References
Sources used for economic projections and traffic data
European Central Bank
(2025). "Eurosystem staff macroeconomic projections for the euro area." ECB Publications.
Eurostat
(2025). "GDP and main components — current prices." European Commission Statistical Office.
World Bank
(2025). "World Bank Open Data: GDP linked series." World Bank Open Data Platform.
International Monetary Fund
(2025). "World Economic Outlook Database." IMF Publications.
AENA
(2025). "Official international traffic statistics — Adolfo Suárez Madrid-Barajas Airport." AENA Estadísticas.
- airport-planning
- traffic-forecast
- madrid-barajas
- aena
- aviation-infrastructure
- gdp-correlation
- iata-busy-day