


Mastering Electronic Spreadsheets: Data to Analysis Guide
Learn electronic spreadsheets from basic components to advanced AI features. Covers Excel, Google Sheets, formulas, pivot tables, and data visualization.
Electronic Spreadsheets
From Data Entry to Complex Analysis
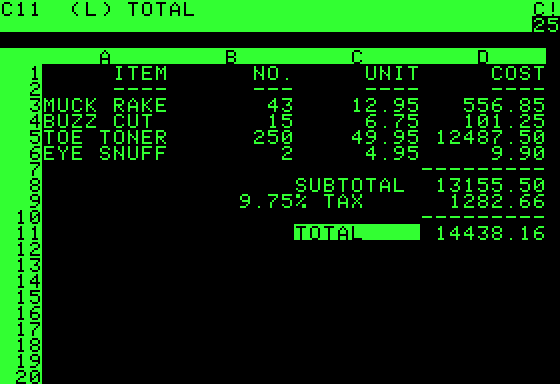
What is an Electronic Spreadsheet?
An electronic spreadsheet is a software tool used to organize, store, and analyze data in a tabular form. It essentially simulates a paper worksheet but adds computational power, automation, and dynamic updating capabilities.
• Organizes data into rows and columns<br>• Performs mathematical calculations automatically<br>• Visualizes data through charts and graphs
A Brief History
• 1979: VisiCalc - The first electronic spreadsheet for the Apple II.<br>• 1983: Lotus 1-2-3 - Became the industry standard for DOS.<br>• 1985: Microsoft Excel - Launched for Mac, later Windows.<br>• 2006: Google Sheets - Pioneered cloud-based collaboration.
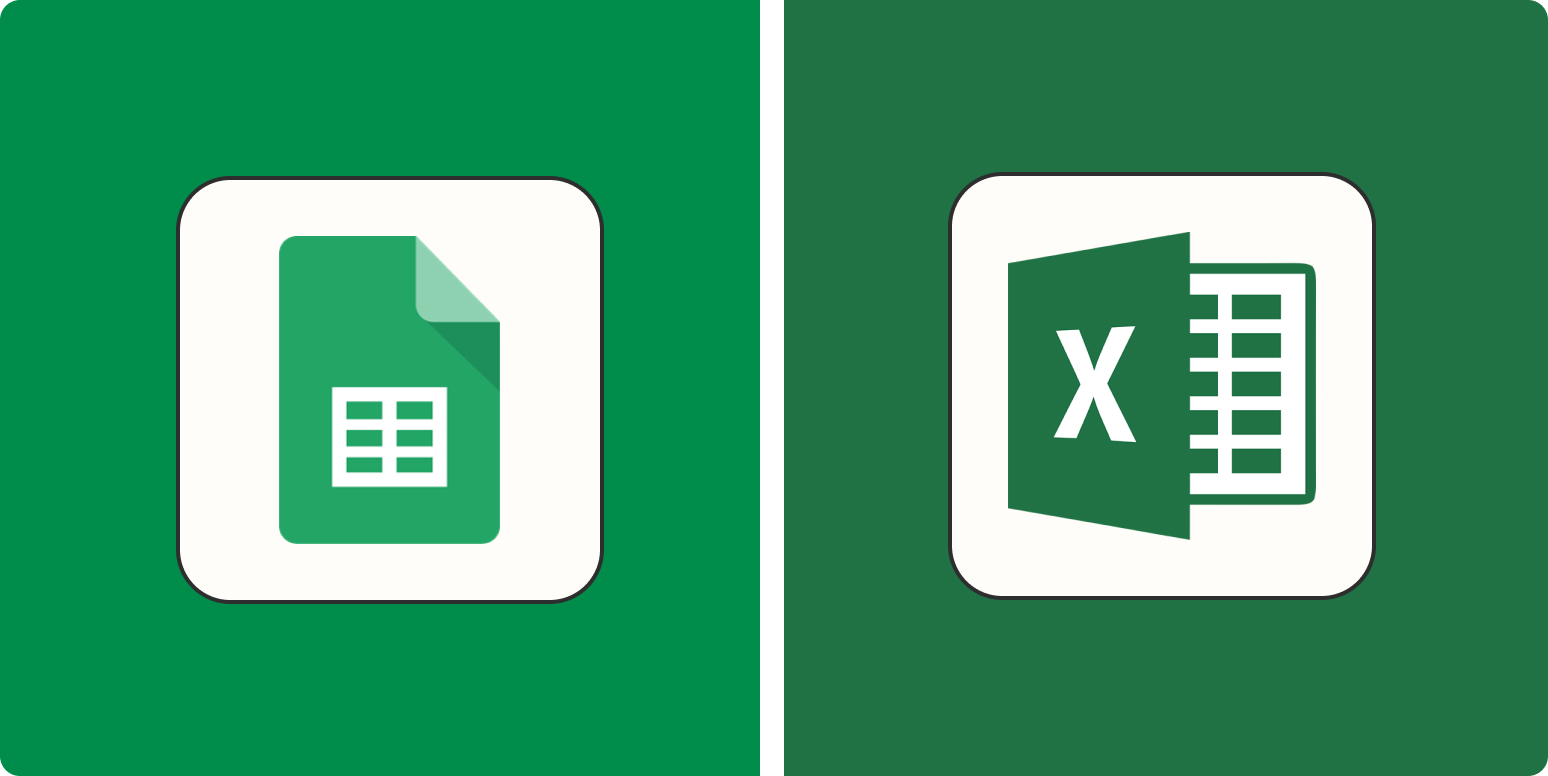
Popular Modern Tools
While the core functionality remains similar, different users prefer different platforms based on their ecosystem.
<strong>Microsoft Excel</strong><br>Industry standard, powerful features.<br><br><strong>Google Sheets</strong><br>Web-based, best for realtime collaboration.<br><br><strong>LibreOffice Calc</strong><br>Open-source, free alternative.
Key Components
Rows & Columns
Horizontal Rows (labeled by Numbers 1,2,3...) and Vertical Columns (labeled by Letters A,B,C...) form the basic grid structure.
Cells & Active Cell
The intersection of a row and column is a Cell (e.g., A1, B5). The Active Cell is the one currently selected with a thick border.
Data Types
• Labels (Text): Alphanumeric characters usually used for headings and names.<br>• Values (Numbers): Numerical data used for calculations.<br>• Dates/Times: Special formats recognized as sequential values.<br>• Booleans: TRUE or FALSE logical values.
Formulas: The Power of Calculation
A formula is an expression that operates on values in a range of cells. All formulas must start with an equals sign (=).
<code>= 5 + 2</code> (Returns 7)<br><code>= A1 + A2</code> (Adds value of A1 and A2)<br><code>= C5 * 0.5</code> (Multiplies C5 by 50%)<br><code>= (A1+B1)/2</code> (Calculates average manually)
Essential Functions
Functions are predefined formulas that perform calculations using specific values (arguments) in a particular order.
<ul><li><strong>SUM(A1:A10)</strong>: Adds all numbers in the range.</li><li><strong>AVERAGE(B1:B20)</strong>: Calculates the arithmetic mean.</li><li><strong>MIN(C1:C5)</strong>: Returns the smallest number.</li><li><strong>MAX(D1:D5)</strong>: Returns the largest number.</li><li><strong>COUNT(A1:A10)</strong>: Counts cells containing numbers.</li></ul>
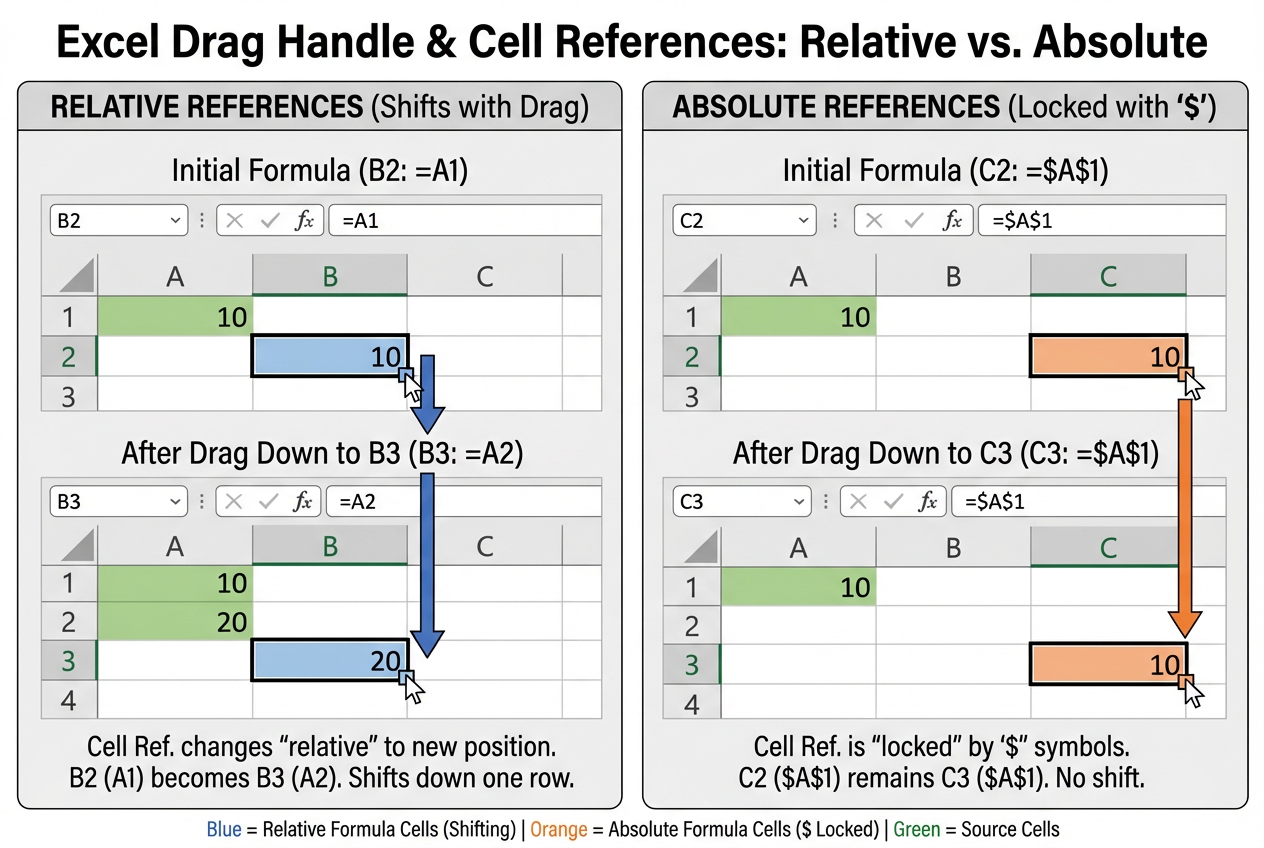
Relative vs. Absolute Referencing
<strong>Relative Reference (A1)</strong><br>Adjusts automatically when copied to another cell. If you copy a formula down one row, A1 becomes A2.
<strong>Absolute Reference ($A$1)</strong><br>Specifically locks the row and/or column. $A$1 does not change when copied elsewhere.
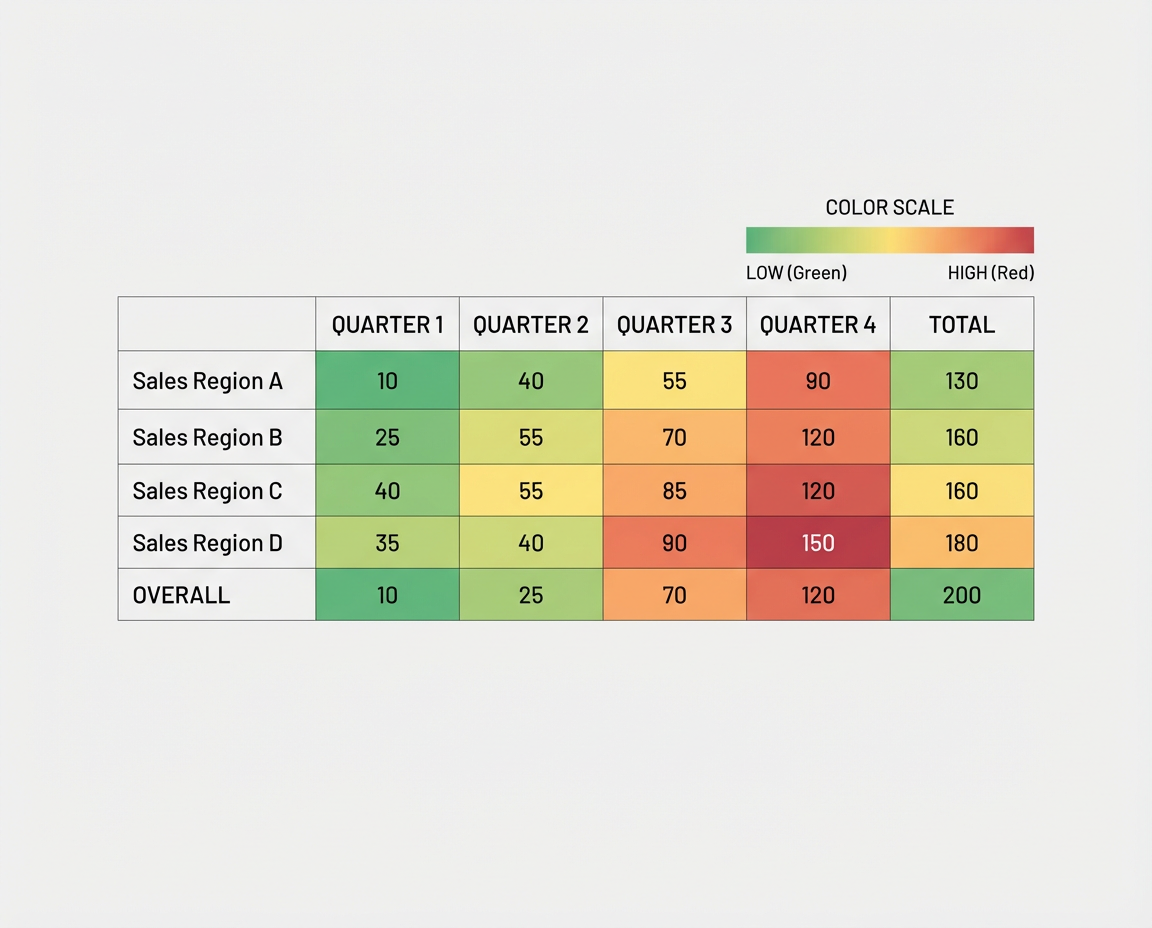
Conditional Formatting
Allows you to apply specific formatting to cells that meet certain criteria. It is crucial for visual data analysis.
• Highlight values above average<br>• Color scales (Heat maps)<br>• Data bars inside cells<br>• Highlight duplicates
Visualizing Data with Charts
Charts transform raw numbers into visual stories. Below shows typical business usage of spreadsheets.
Sorting & Filtering
<strong>Sorting:</strong> Organizing data in a specific order (e.g., A to Z, Smallest to Largest). Helps in ranking and quick lookup.
<strong>Filtering:</strong> Displaying only the rows that meet certain criteria (e.g., showing only employees in the 'Sales' department). Essential for managing large datasets.
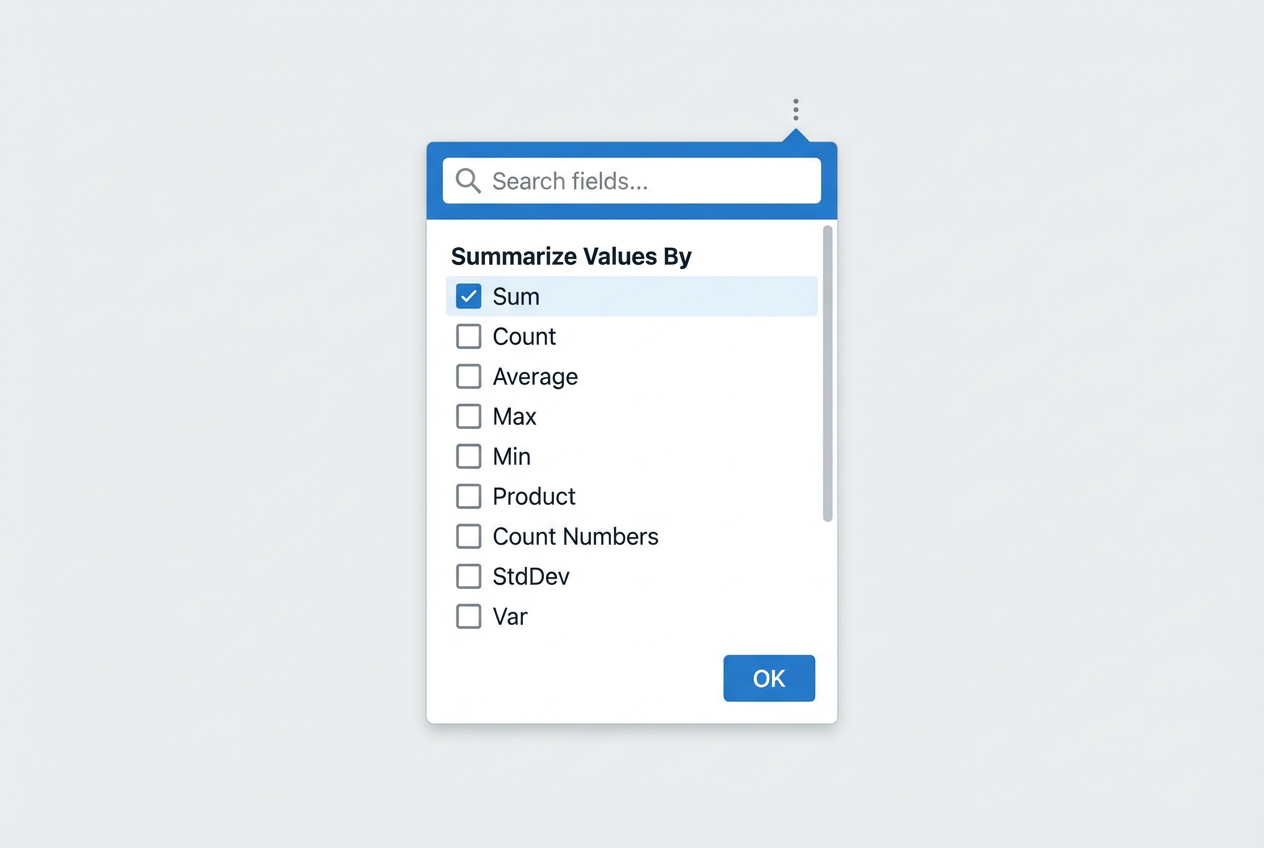
Pivot Tables
A powerful feature that allows you to summarize significant amounts of data. It can reorganize, count, total, or average data stored in one table and display the results in a second table.
Example: Turning a list of 1000 sales transactions into a summary table showing 'Total Revenue per Region'.
Collaboration & Pros/Cons
<h3 style='color:#1D6F42; margin-bottom:15px;'>Advantages</h3><ul><li>Real-time collaboration (Cloud)</li><li>Automated calculations</li><li>Versatile for many industries</li><li>Portable formats (CSV, XLSX)</li></ul>
<h3 style='color:#b71c1c; margin-bottom:15px;'>Disadvantages</h3><ul><li>User entry errors (Typographical)</li><li>Not suitable for massive big data (1M+ rows)</li><li>Security risks if not protected</li><li>Version control issues (Offline)</li></ul>
The Future: AI in Spreadsheets
The next generation of spreadsheets is powered by AI (e.g., Microsoft Copilot, Google Duet AI).
• <strong>Natural Language Queries:</strong> 'Show me top sales' instead of writing formulas.<br>• <strong>Auto-Pattern Recognition:</strong> Detecting trends automatically.<br>• <strong>Predictive Analytics:</strong> Forecasting future data based on history.
- spreadsheets
- microsoft-excel
- google-sheets
- data-analysis
- pivot-tables
- excel-formulas
- software-tutorial