
VVPL Financial Performance & Sales Analysis 2025-26
Explore Vishuddha Vision Pvt Ltd's 2025-26 sales report covering B2B, online, and direct channels, featuring a massive October revenue surge and Tally data.
VVPL Reports 2025-26
Financial Performance & Sales Analysis (April - December)
Vishuddha Vision Pvt Ltd
Report Overview
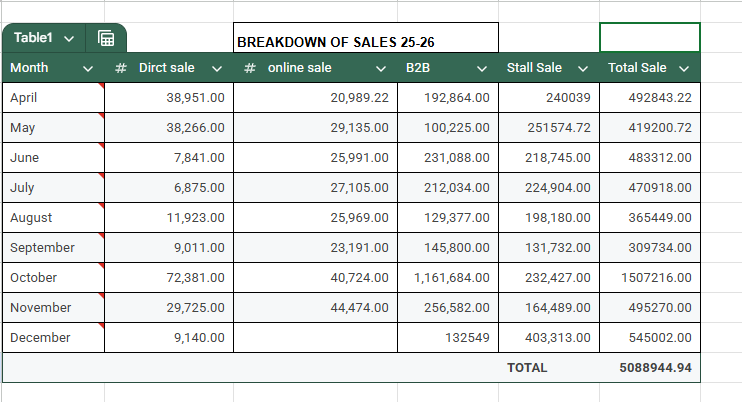
Consolidated Sales Performance (April - December 2025)
Channel Breakdown: Direct, Online, B2B, and Stall Sales
Monthly Trend Analysis & October Peak
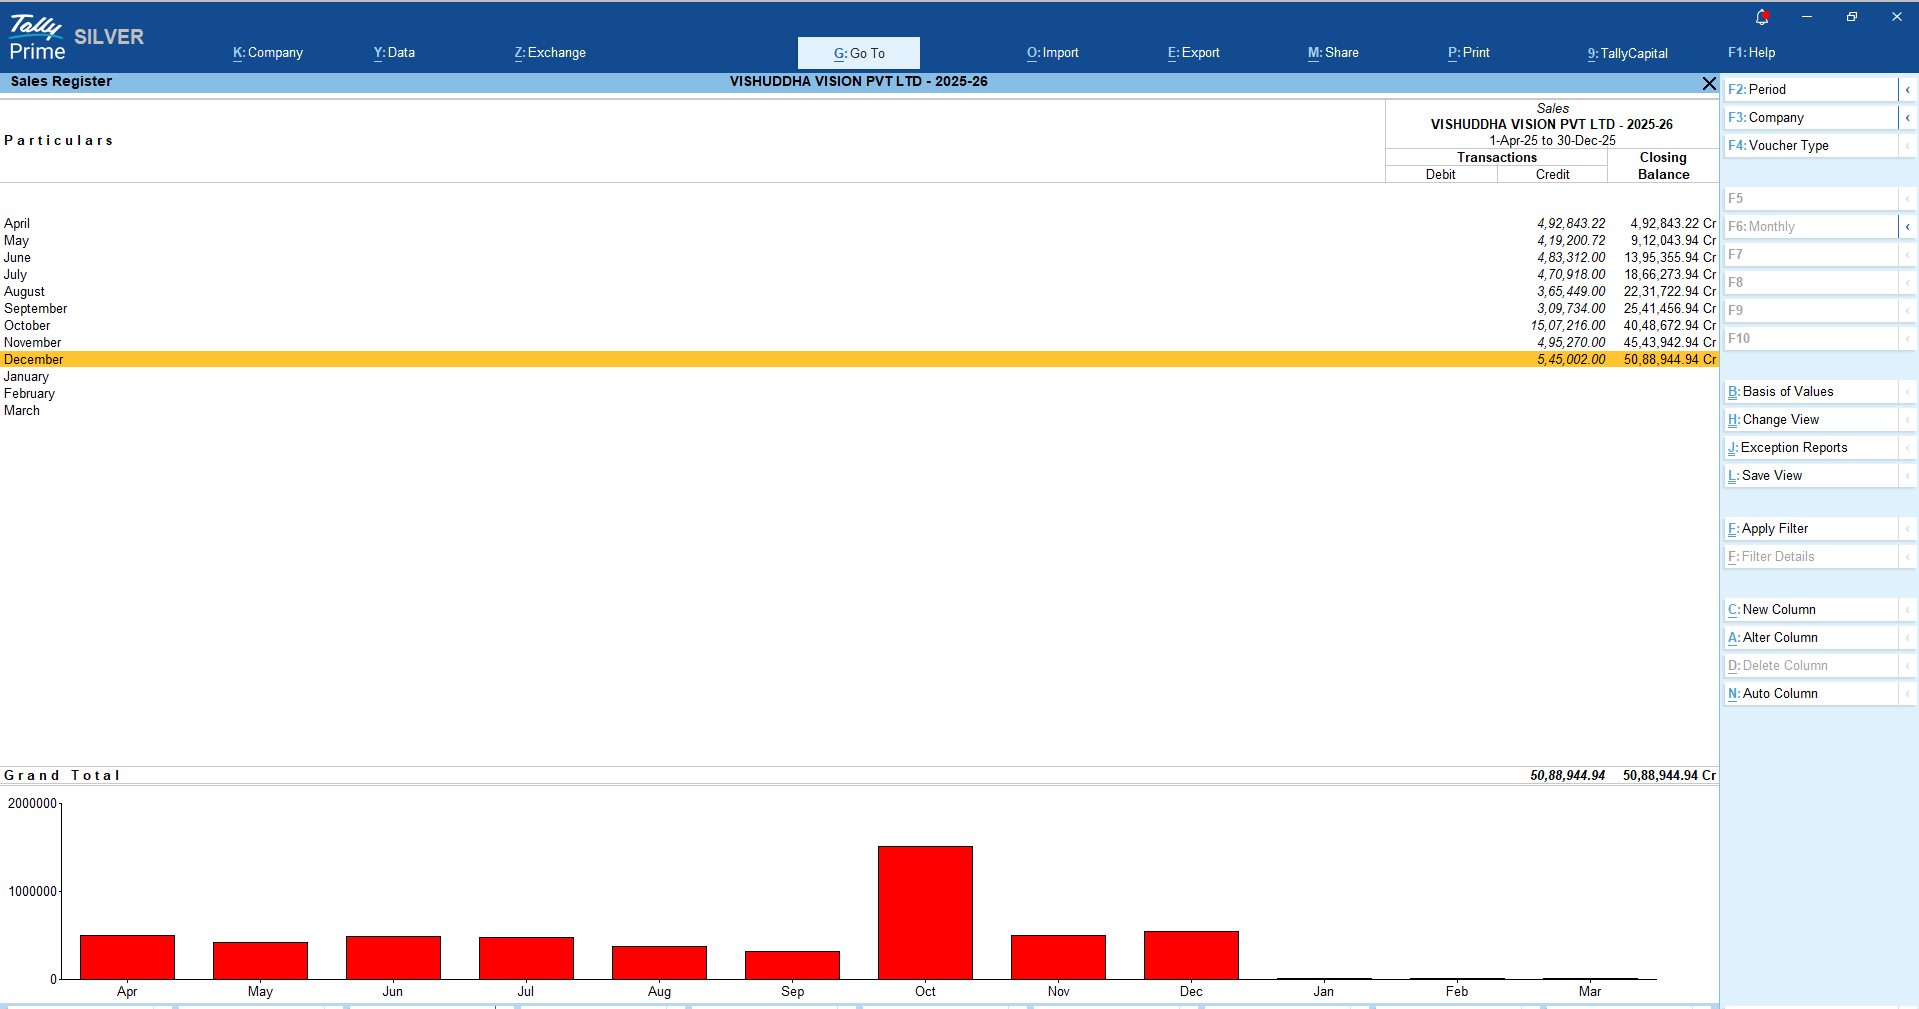
Source Data Validation (Tally Prime & Registers)
Monthly Total Sales Trend
Total accumulated sales reached approx. 5.08 Million. A significant spike is observed in October due to seasonal demand or major contracts.
The October Surge
October 2025 was the highest performing month, generating over 1.5 Million in revenue. This is nearly 3x the average of other months. The primary driver for this surge was the B2B sector, which alone contributed 1,161,684 to the total.
Sales Channel Analysis
B2B and Stall Sales are the dominant revenue streams. Direct and Online sales constitute a smaller portion of the overall portfolio.
Source: Consolidated Sales Breakdown Spreadsheet (Apr-Dec 2025)
Performance: B2B vs. Stall Sales
While Stall Sales remain consistent (averaging ~200k-250k), B2B sales show high volatility with a massive spike in October (1.16M).
System Validation: Tally Prime
The sales register from Tally Prime confirms the consolidated figures. The 'Closing Balance' column aligns perfectly with the total sales report, showing a cumulative 50,88,944.94 Cr by December.
Total Sales: 5,088,944.94
Consolidated Revenue (Apr - Dec 2025)
Executive Summary & Key Takeaways
Seasonal Variability: Sales are heavily influenced by the October high-season.
Channel Reliance: B2B is the top revenue generator, followed by Stall Sales.
Growth Areas: Direct and Online sales show stability but require scaling.
- sales-analysis
- financial-report
- b2b-sales
- revenue-trends
- business-performance
- tally-prime
- vvpl