

Climate Regions: Geography Factors and World Systems
Explore global climate regions, South Africa's climate factors, and weather elements like latitude, altitude, and ocean currents in this Grade 8 guide.
CLIMATE REGIONS
Grade 8 Geography • Term 2
Understanding our world's amazing climate systems 🌍
Social Sciences Learner's Book
CAPS 2026 Aligned
WHAT YOU WILL LEARN
This term we explore Climate Regions — broken into 3 units:
💡 Don't worry — we will explain everything step by step!
Unit 1: Factors That Influence Temperature & Rainfall
Unit 2: South Africa's Climate Regions
Unit 3: Climate Around the World
Latitude
Distance from Sea
Altitude
Ocean Currents
Mountains
KEY VOCABULARY — WORD BANK
📚 Learn these words — they appear in every activity and test!
THERMOMETER
A tool used to measure temperature (how hot or cold the air is)
TEMPERATURE
How hot or cold a place is, measured in degrees Celsius (°C)
ANEMOMETER
An instrument that measures wind speed
HUMIDITY
The amount of water vapour (moisture) in the air
WIND
Air that is moving over the Earth's surface
PRECIPITATION
Any water that falls from the sky: rain, hail, snow, frost
WEATHER
The daily condition of the atmosphere (changes every day, observed over hours)
CLIMATE
The average weather of a place over many years (months or years)
CONDUCTION
How heat flows through a substance like air or water
ALTITUDE
The height of a place above sea level
WINDWARD
The side of a mountain where the wind blows FROM
TEMPERATURE RANGE
Difference between warmest and coldest monthly average temperatures
🌦️ WEATHER
🌍 CLIMATE
The day-to-day condition of the atmosphere at a specific place and time.
The average weather conditions of a place over a long period of time (months or years).
Changes every day
Observed over a small area
Short time period (hours or 24 hours)
Stays generally the same over years
Observed over a large area
Long time period (30+ years of data)
Today in Johannesburg it is hot and sunny.
Johannesburg has hot wet summers and dry cold winters.
🧠 <strong style="color: #E07B39; font-weight: 800;">EASY TRICK:</strong> Weather = What's happening <span style="text-decoration: underline; font-weight: 700; color: #2D6A4F;">TODAY</span>. Climate = What <span style="text-decoration: underline; font-weight: 700; color: #2D6A4F;">USUALLY</span> happens.
UNIT 1
FACTORS THAT INFLUENCE TEMPERATURE & RAINFALL
There are 5 key factors that control how hot, cold, wet or dry a place is.
1. Latitude (Distance from the Equator)
2. Distance from the Sea
3. Altitude (Height Above Sea Level)
4. Ocean Currents
5. Mountains (Relief)
We will explore each factor one by one — with diagrams and examples!
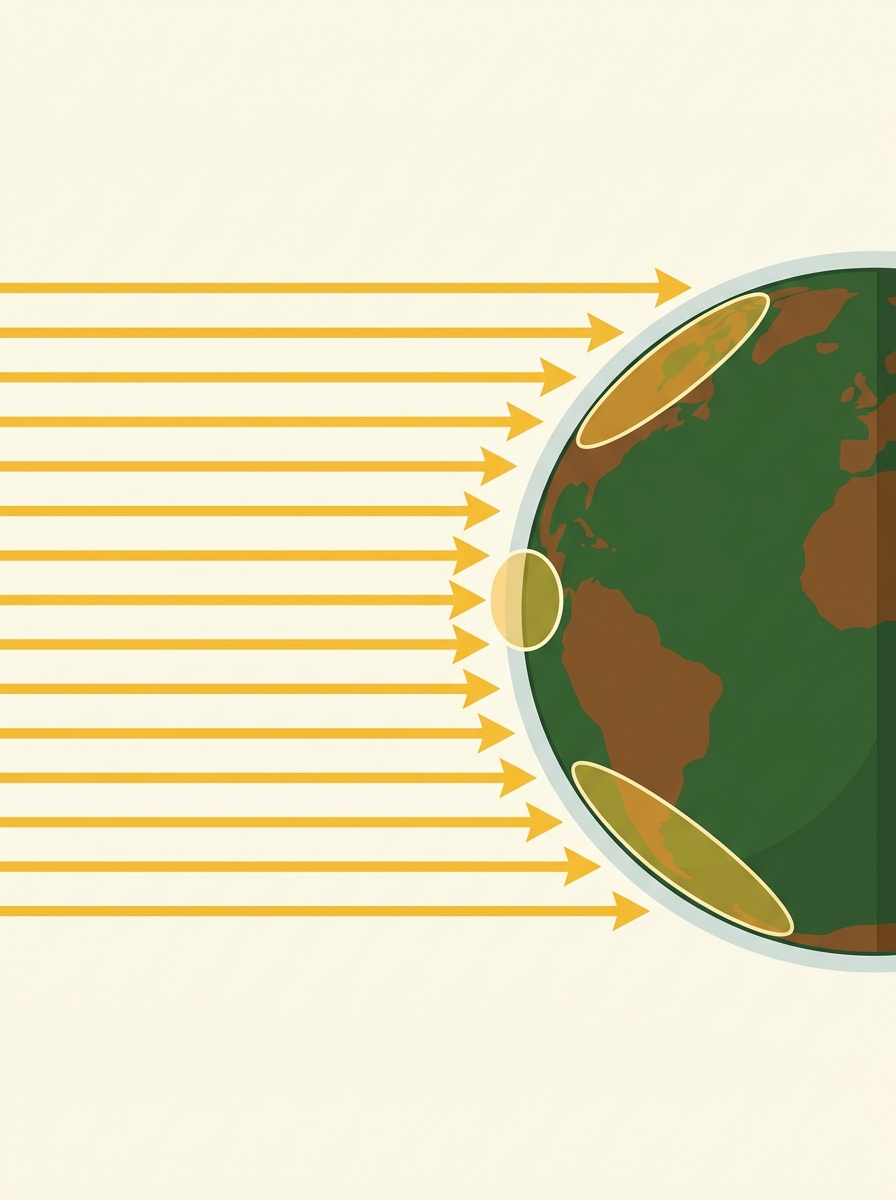
LATITUDE
FACTOR 1
Distance from the Equator
Bangui
26°C
East London
14°C
LATITUDE & RAINFALL — What happens to rain near the equator?
Average Annual Rainfall by Latitude
Near the Equator (warm) → Rain falls as <b>LIQUID RAIN</b>
Near the Poles (cold) → Precipitation falls as <b>SNOW</b>
Middle latitudes → Rain in summer, snow in winter
The wettest places on Earth are within 25° of the equator
Wetter = closer to equator. Drier = closer to poles.
FACTOR 2:
DISTANCE FROM THE SEA
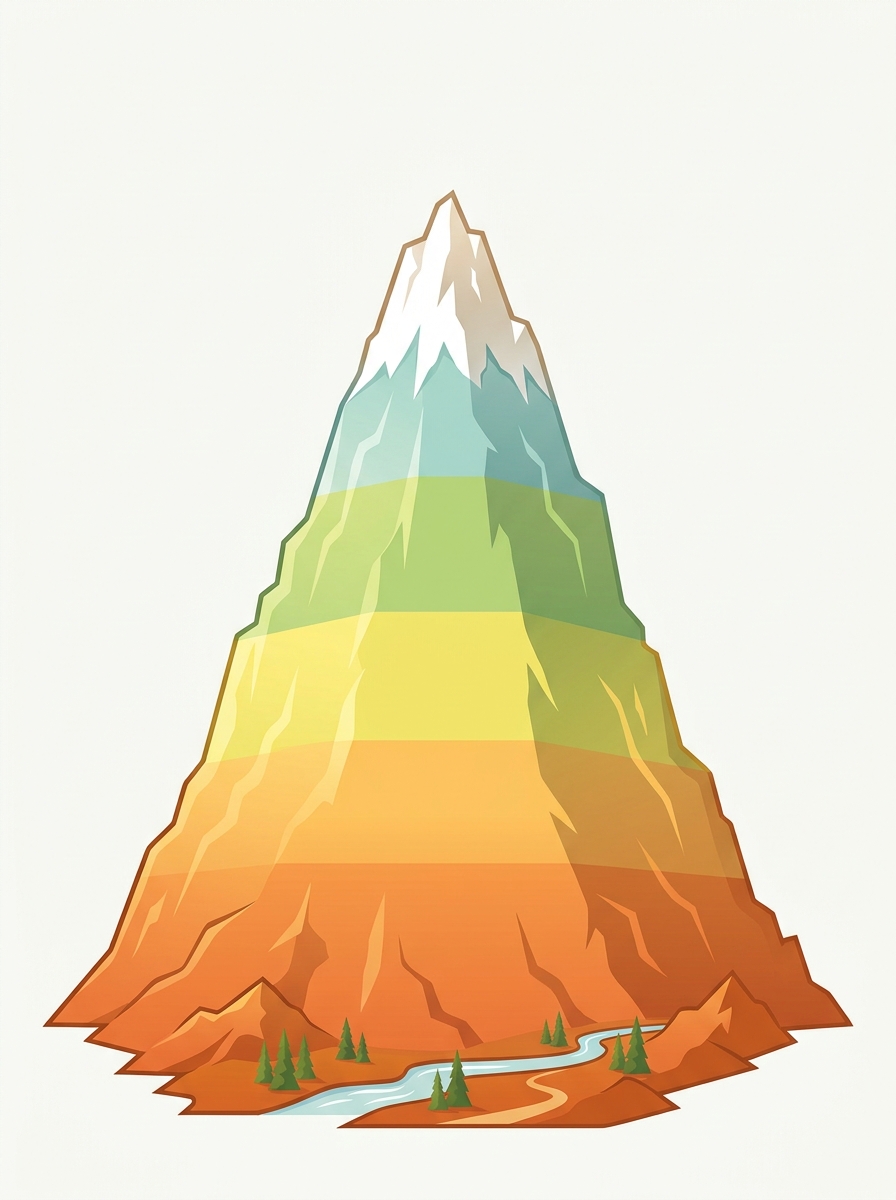
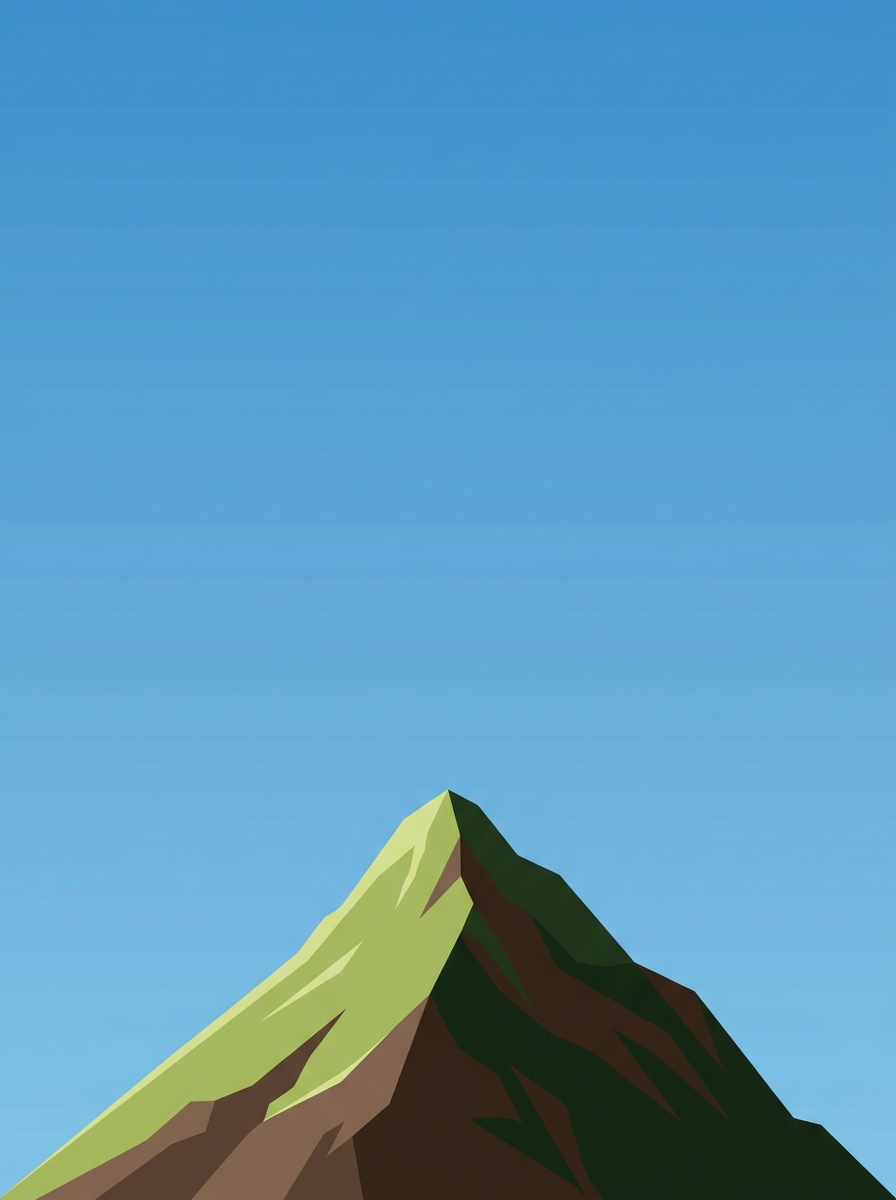
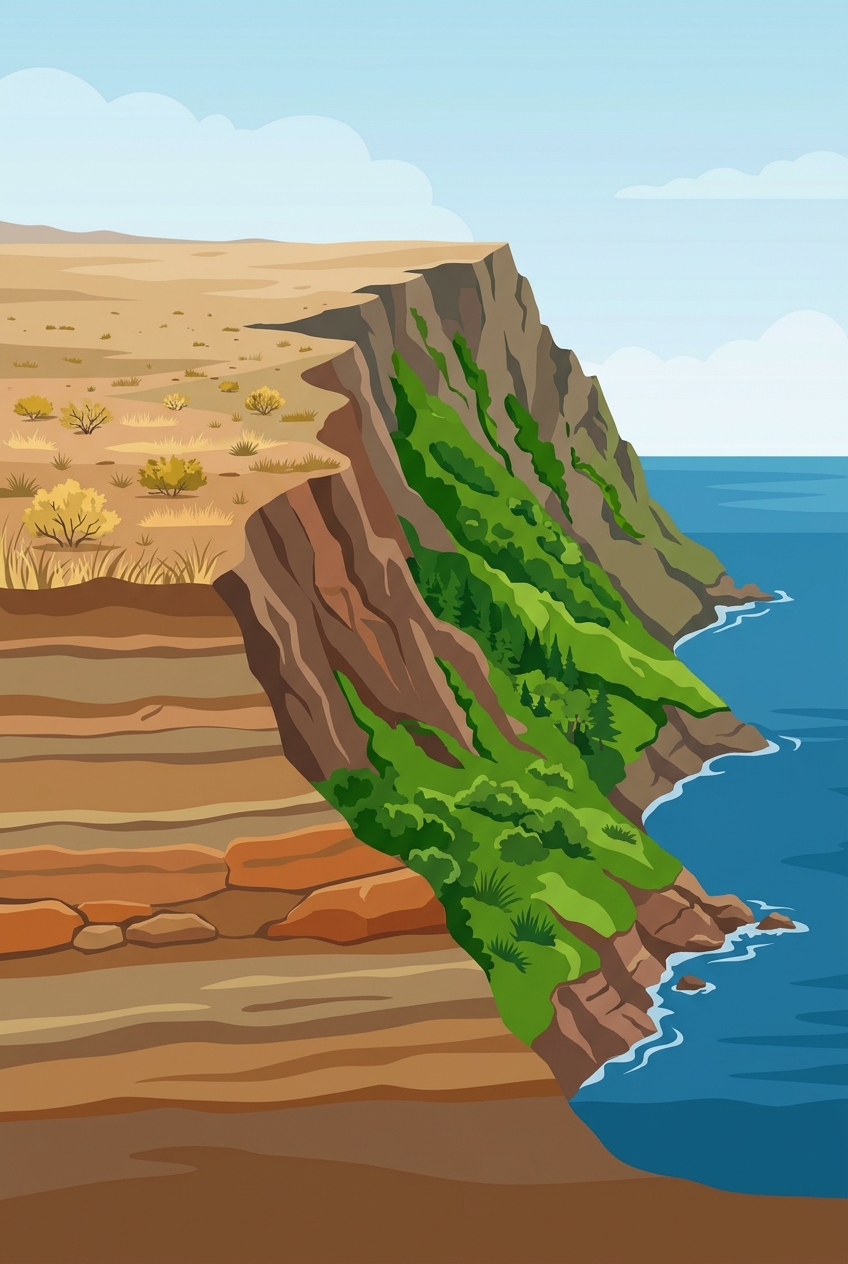
FACTOR 3: ALTITUDE
Height Above Sea Level
The HIGHER up you go, the COLDER it gets!
Temperature drops 6.5°C for every 1,000 metres you go UP
The sun heats the Earth's <strong>SURFACE</strong> first
The warm ground then heats the air <strong>ABOVE</strong> it
Higher up = less air molecules = air stays <strong>COLD</strong>
Think of climbing a mountain — the higher you go, the colder it gets! Snow is only at the top.
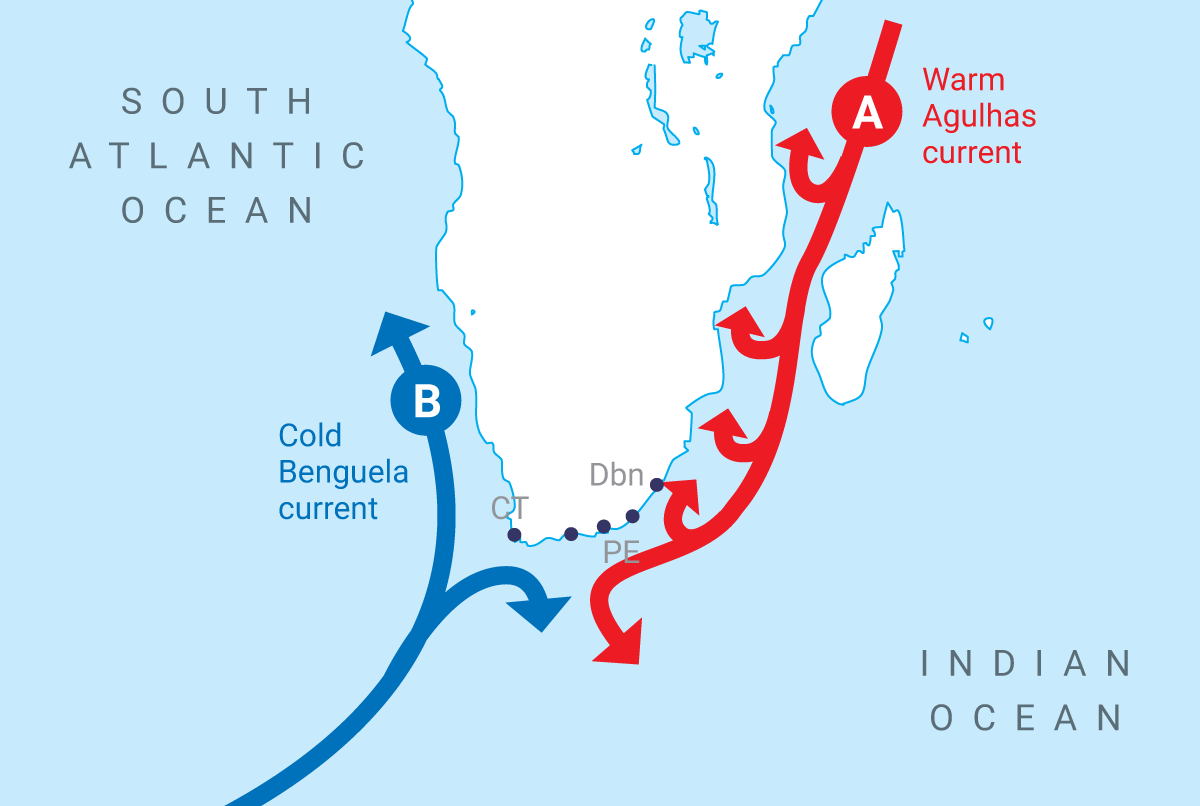
FACTOR 4: OCEAN CURRENTS
How moving ocean water affects our climate
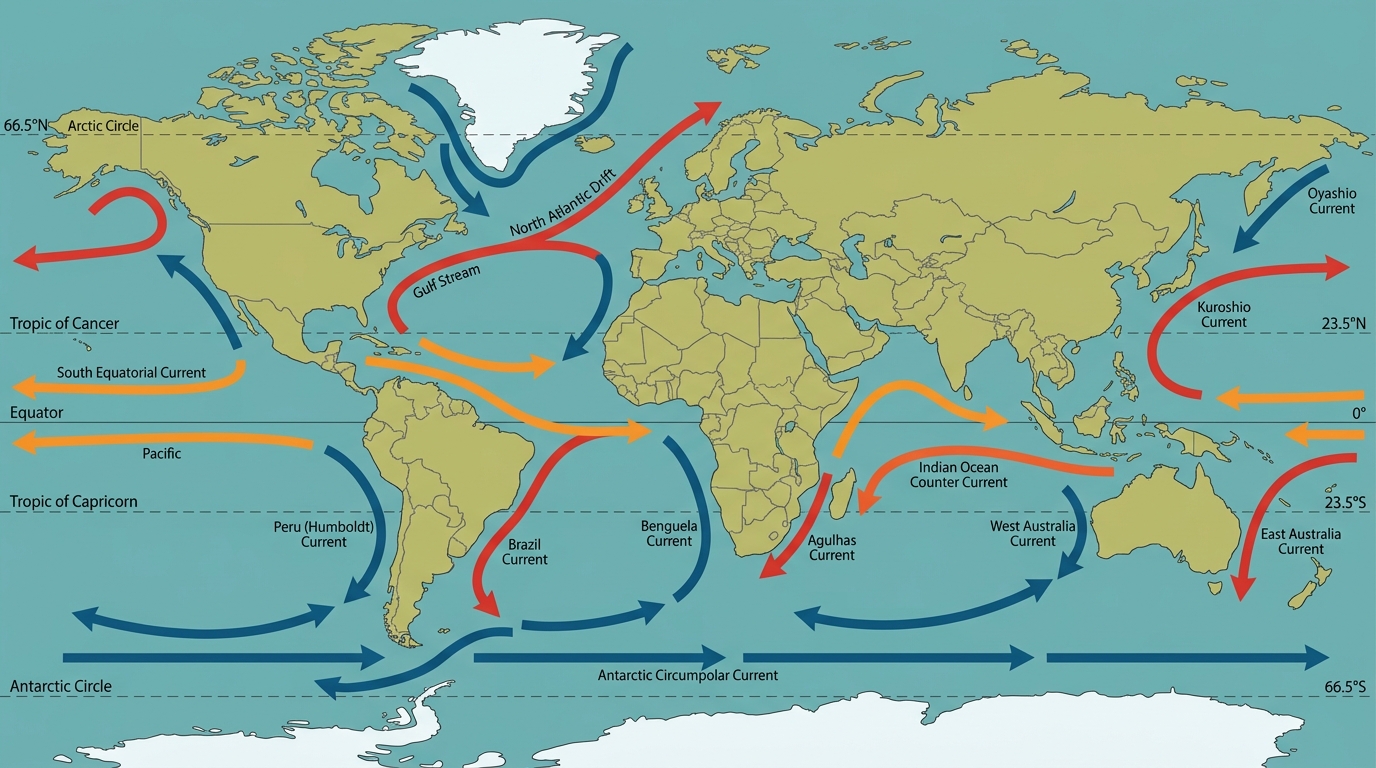
WORLD OCEAN CURRENTS — Warm & Cold
🔴 Warm current → warms coast, brings rain
🔵 Cold current → cools coast, brings dry conditions
Agulhas → Durban 20.4°C
Benguela → Port Nolloth 14.4°C
Warm currents create more rainfall
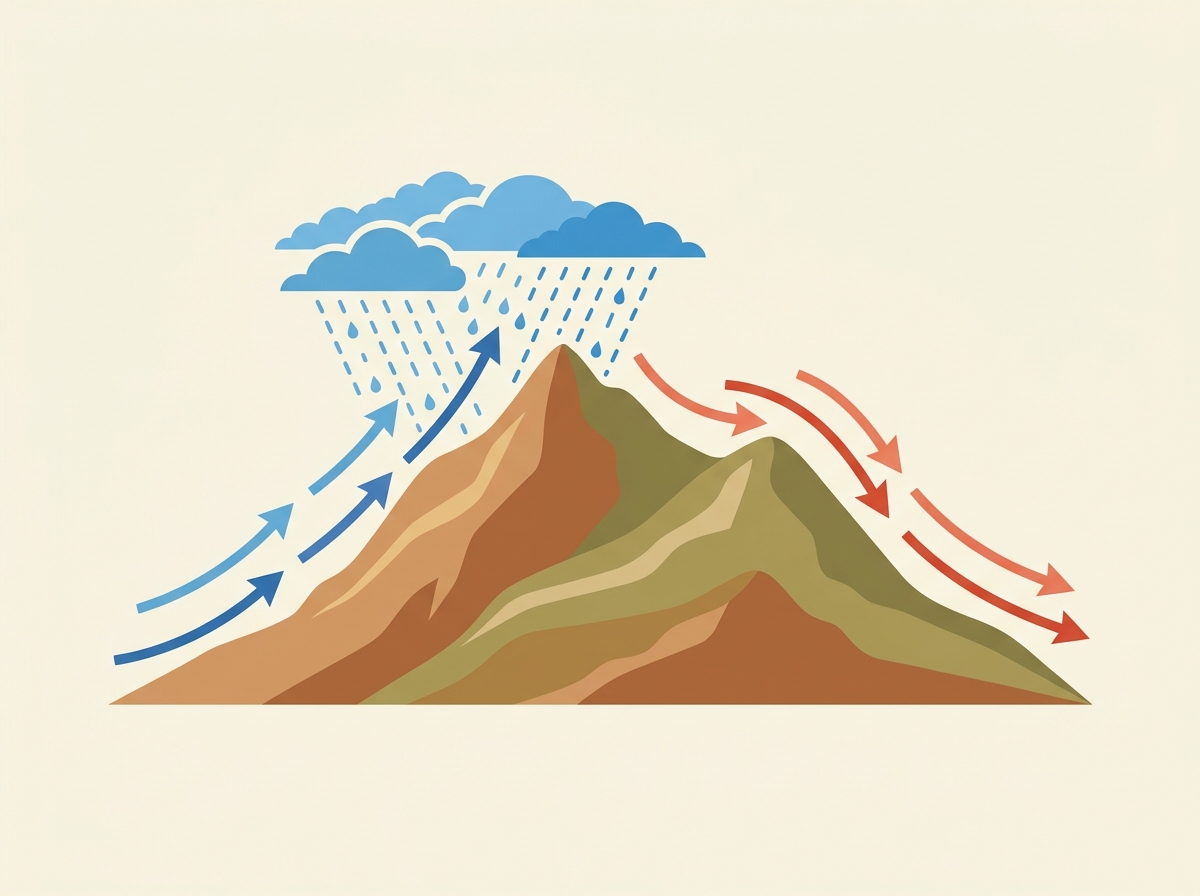
FACTOR 5: MOUNTAINS (RELIEF)
How mountains affect temperature
Mountains affect HOW MUCH sunlight different areas receive.
North-facing slopes (Southern Hemisphere) → face the sun → WARMER
South-facing slopes → face away from sun → COOLER
Areas in direct sunlight for longer = higher temperatures
Areas in shadow = much cooler temperatures
In South Africa, people prefer to build houses on NORTH-FACING slopes — they get more sun and are warmer!
Same mountain — different temperatures!
South-facing slope: 13°C average
North-facing slope: 23°C average
DIFFERENCE = 10°C!
WARM — 23°C
Direct rays
COOL — 13°C
Angled rays
COLD
Always in shadow
◀ NORTH
SOUTH ▶
🧠 In South Africa: NORTH-facing slope = WARMER (faces the sun). SOUTH-facing slope = COOLER (faces away from sun).
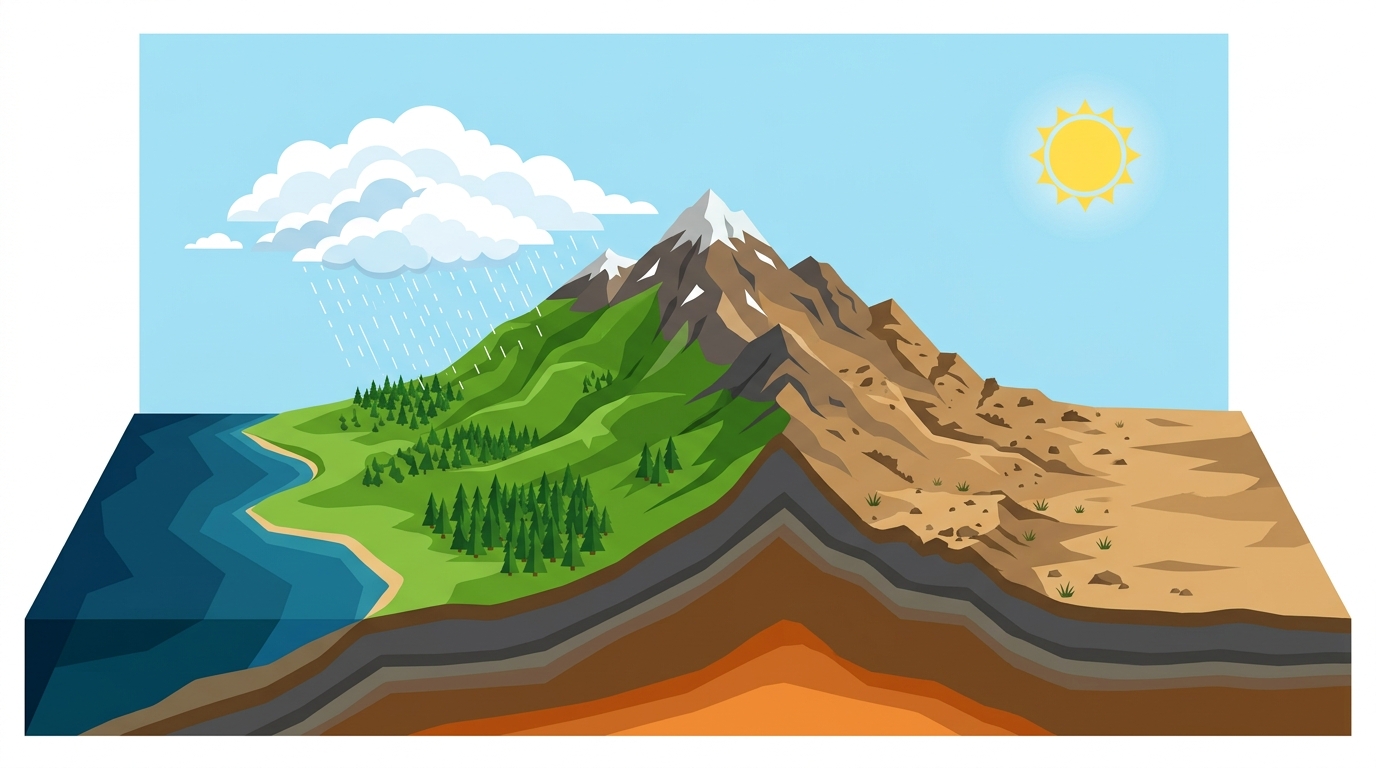
HOW MOUNTAINS CREATE RELIEF RAIN & RAIN SHADOW AREAS
🧠 Windward side = WET (wind brings moisture up). Leeward/Rain shadow = DRY (wind has lost moisture going over mountain).
HOW MOUNTAINS AFFECT WINDS — 3 Key Effects
🧠 Mountains can: FORCE rain (ascent), CHANNEL cold winds (funneling), or BLOCK cold winds (blocking).
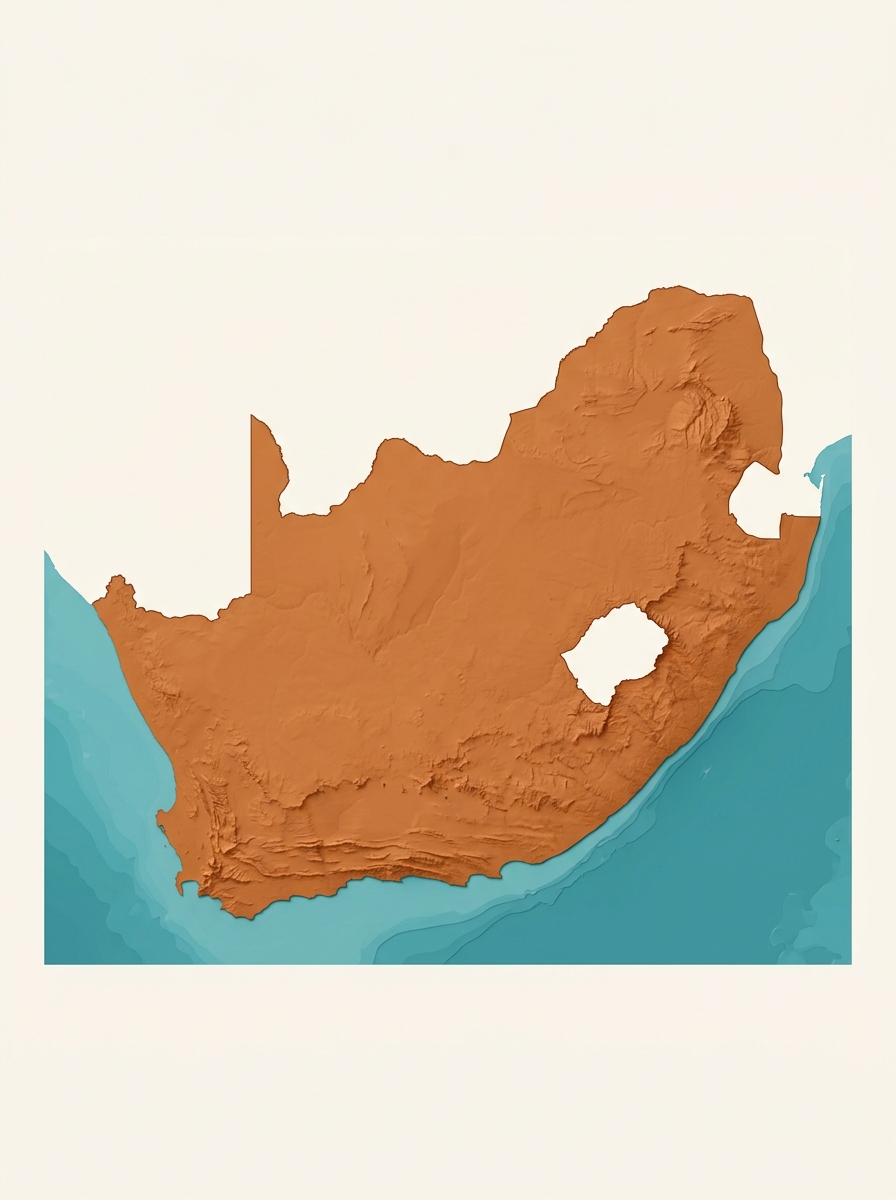
UNIT 2
SOUTH AFRICA'S CLIMATE
South Africa has many different climate regions because of its unique geography.
Ranges in altitude from low coastal plains to high mountains and a plateau
Stretches over 12° of latitude (north to south)
Its centre is far from the ocean
Influenced by different wind systems
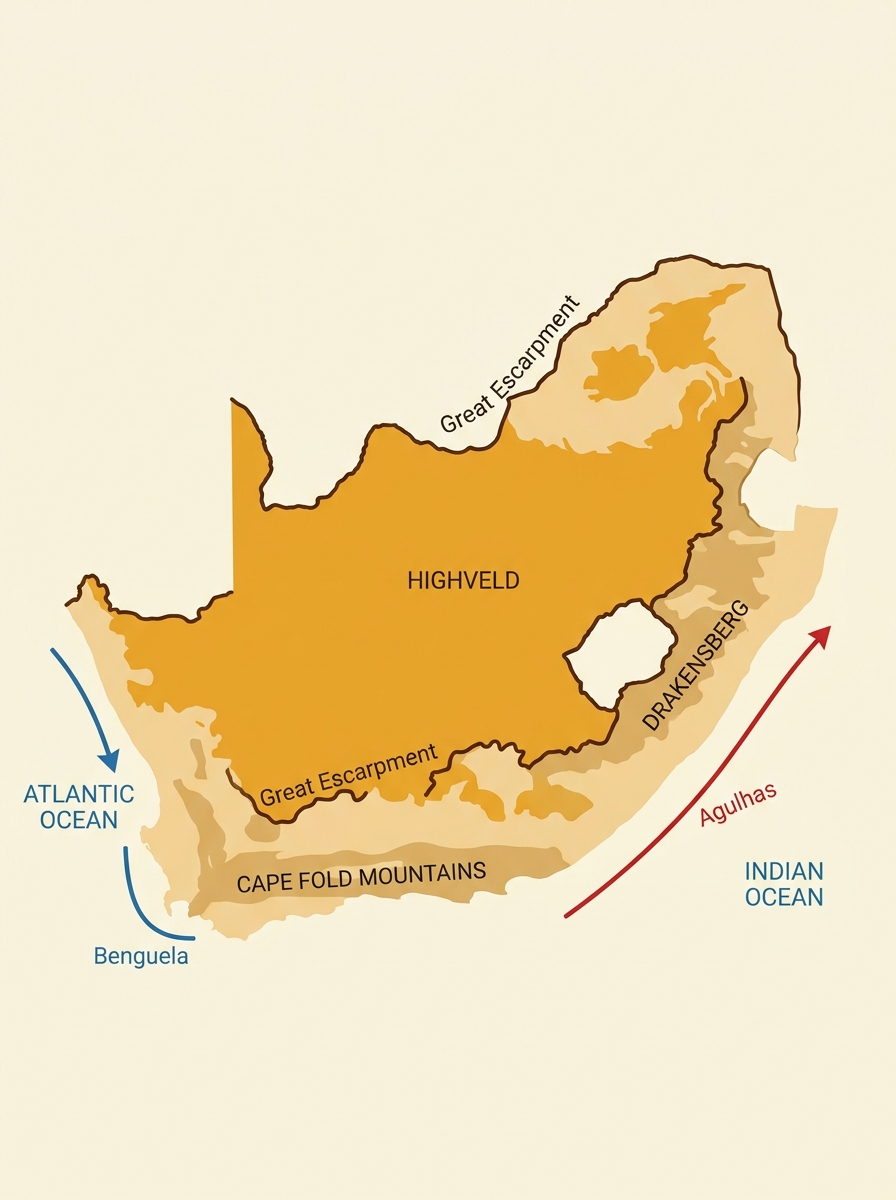
East coast = warm Agulhas current | West coast = cold Benguela current
We will look at how each of the 5 factors affects South Africa specifically!
Port Nolloth
Cape Town
Johannesburg
Durban
LATITUDE IN SOUTH AFRICA
South Africa covers about 10 degrees of latitude (from 22°S to 35°S). Places further south are generally cooler.
Polokwane
23°53'S
23°C
12°C
Bloemfontein
29°06'S
22°C
7°C
Port Elizabeth
33°59'S
20°C
14°C
Polokwane is closest to equator → hottest summers. Port Elizabeth is furthest south → coolest summers.
Port Elizabeth has WARMER winters than Bloemfontein — why? → Distance from sea!
DISTANCE FROM THE SEA IN SOUTH AFRICA
Upington
400km from Atlantic Ocean
28°C
12°C
16°C
200mm/year
FAR from sea → EXTREME temperature range. HOT summers, COLD winters. Very DRY.
Durban
Right on Indian Ocean coast
24°C
16°C
8°C
1,008mm/year
NEAR the sea → MODERATE temperatures. Warm winters. Much WETTER.
🧠 Same country — VERY different climates! Location is everything.
Altitude's Effect in South Africa
Johannesburg, Mbombela, and Maputo are at SIMILAR latitudes. BUT their altitudes are very different — causing very different temperatures!
Johannesburg is 1,740m above sea level — that's why it's MUCH COLDER than coastal cities at the same latitude!
Johannesburg gets FROSTS (ground freezes) in winter — altitude makes it colder!
THE DRAKENSBERG MOUNTAIN EFFECT
The Drakensberg acts like a wall — trapping moist Indian Ocean air on the east, making the west much drier.
High altitude = colder + frost-risk. Mountains block rain = dry leeward side.
THE 4 ELEMENTS OF WEATHER
Weather is made up of these 4 main elements
⭐ These 4 elements are what we measure to describe the WEATHER and CLIMATE of a place!
🌡️ TEMPERATURE
How HOT or COLD the atmosphere is — measured in degrees Celsius (°C)
Lowest temperatures: just after sunrise
Highest temperatures: 1-2 hours after midday
Summer = higher temps (Earth tilted toward sun)
Winter = lower temps
Instruments: THERMOMETER
Temperatures are shown on CLIMATE GRAPHS as a LINE
💧 HUMIDITY
The amount of WATER VAPOUR (moisture) held in the air
Hot air holds MORE moisture (higher humidity)
Cold air holds LESS moisture (lower humidity)
High humidity = feels damp/muggy
Low humidity = dry air
Near equator = very high humidity (tropical regions)
Ever noticed how on hot summer days it feels harder to breathe? That's HIGH HUMIDITY!
💨 WIND
Moving air caused by differences in AIR PRESSURE
Wind blows from HIGH pressure → LOW pressure areas
Wind direction = the direction it COMES FROM
Affects temperature and rainfall
Measured by: ANEMOMETER (speed) & WIND VANE (direction)
Beaufort Scale: Force 0 (calm) to Force 12 (hurricane)
Simple Beaufort: F0(Calm) | F3(Leaves move) | F6(Branches move) | F10(Trees down)
🌧️ PRECIPITATION
Any water that falls FROM the atmosphere to the ground
☔ RAIN — most important, measured in mm using rain gauge
❄️ SNOW — water vapour condenses below 0°C into ice crystals
🌨️ HAIL — ice pellets formed in storm clouds (5-50mm dia.)
🌫️ DEW/FROST — forms on the ground when air is cold
Deserts receive less than 250mm of rain per YEAR!
THE BEAUFORT SCALE — Measuring Wind Without Instruments
You can estimate wind speed by OBSERVING what's happening around you!
<strong style="color: #E07B39;">Fun fact:</strong> Force 12 hurricane = winds faster than 120 km/h — strong enough to destroy buildings! Next time it's windy, try to estimate the Beaufort Force!
HOW TO READ A CLIMATE GRAPH
Case Study: Bethlehem, Free State
Climate graphs show AVERAGES — real weather can vary greatly!
UNIT 3
CLIMATE AROUND THE WORLD
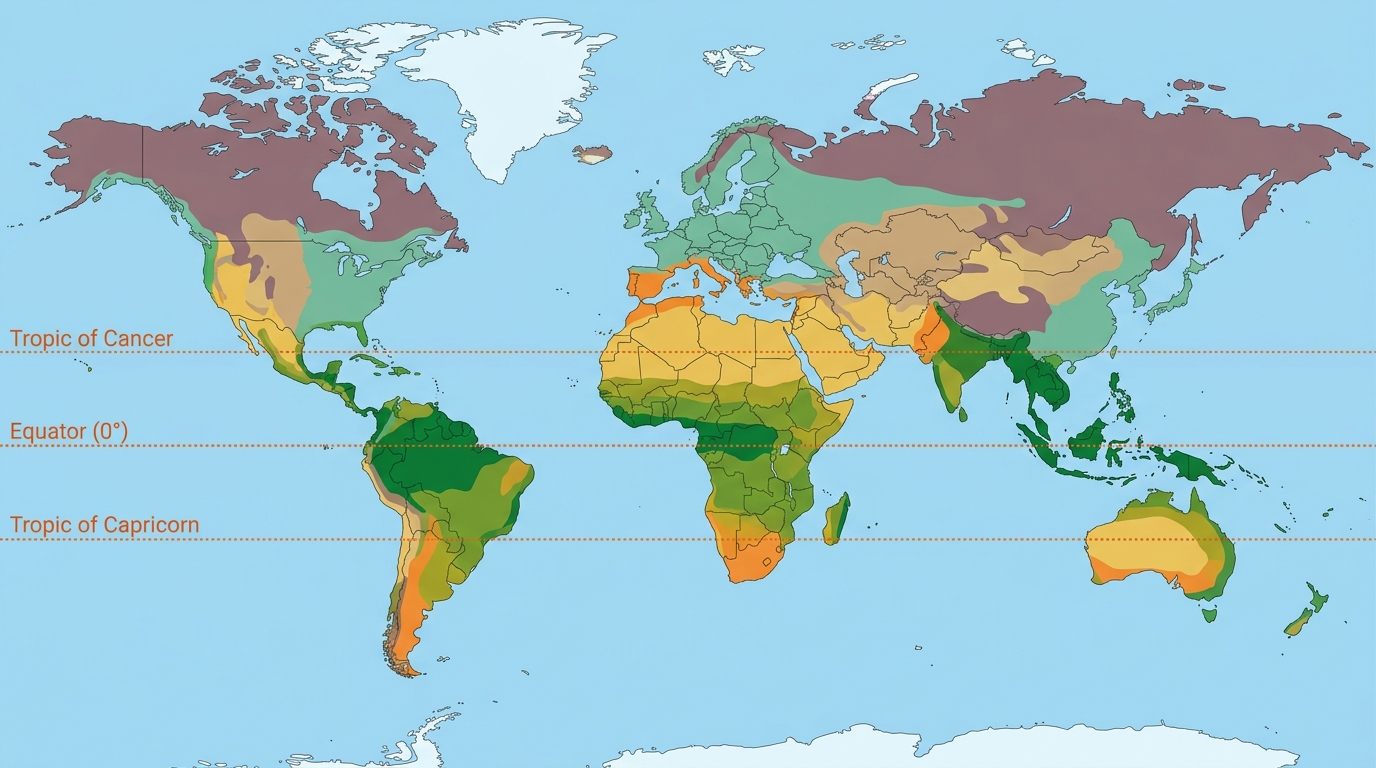
The world has 8 main climate types. Each one has different temperatures and rainfall patterns.
We will study each climate type — where it is, how hot/cold it gets, and how much rain it receives.
🌍 Remember: Latitude, altitude, distance from sea, ocean currents and mountains ALL influence which climate type a place has!
WORLD CLIMATE TYPES — 1 & 2
🌴 TROPICAL CLIMATE
🌅 SUBTROPICAL CLIMATE
0° to 25° North and South of the Equator — within the tropics
20° to 40° from equator, often on east coasts of continents
TROPICAL
SUBTROPICAL
0-25° from equator
20-40° from equator
Very hot all year
Hot summers, mild winters
Very high (2000mm+)
High (1200mm), mostly summer
Rainforest
Mixed forest/grassland
🧠 KwaZulu-Natal has a SUBTROPICAL climate — that's why Durban is warm and humid with lots of summer rain!
WORLD CLIMATE TYPES — 3 & 4
🌧️ TEMPERATE CLIMATE
40° to 65° North and South — typical of much of Northern Europe
Cool summers (15-20°C), cold winters (2-8°C)
🏜️ DESERT CLIMATE
A desert is ANY area receiving less than 250mm of rain per YEAR
🔥 HOT DESERTS
❄️ COLD DESERTS
🧠 Less than 250mm/year = DESERT! The Sahara is hot. Antarctica is cold. BOTH are deserts!
WORLD CLIMATE TYPES 5 TO 8
SEMI-DESERT
250-500mm rain/year with erratic rainfall
Droughts are a common occurrence
High day temperatures, cold nights
<strong>SA Example:</strong> The Karoo
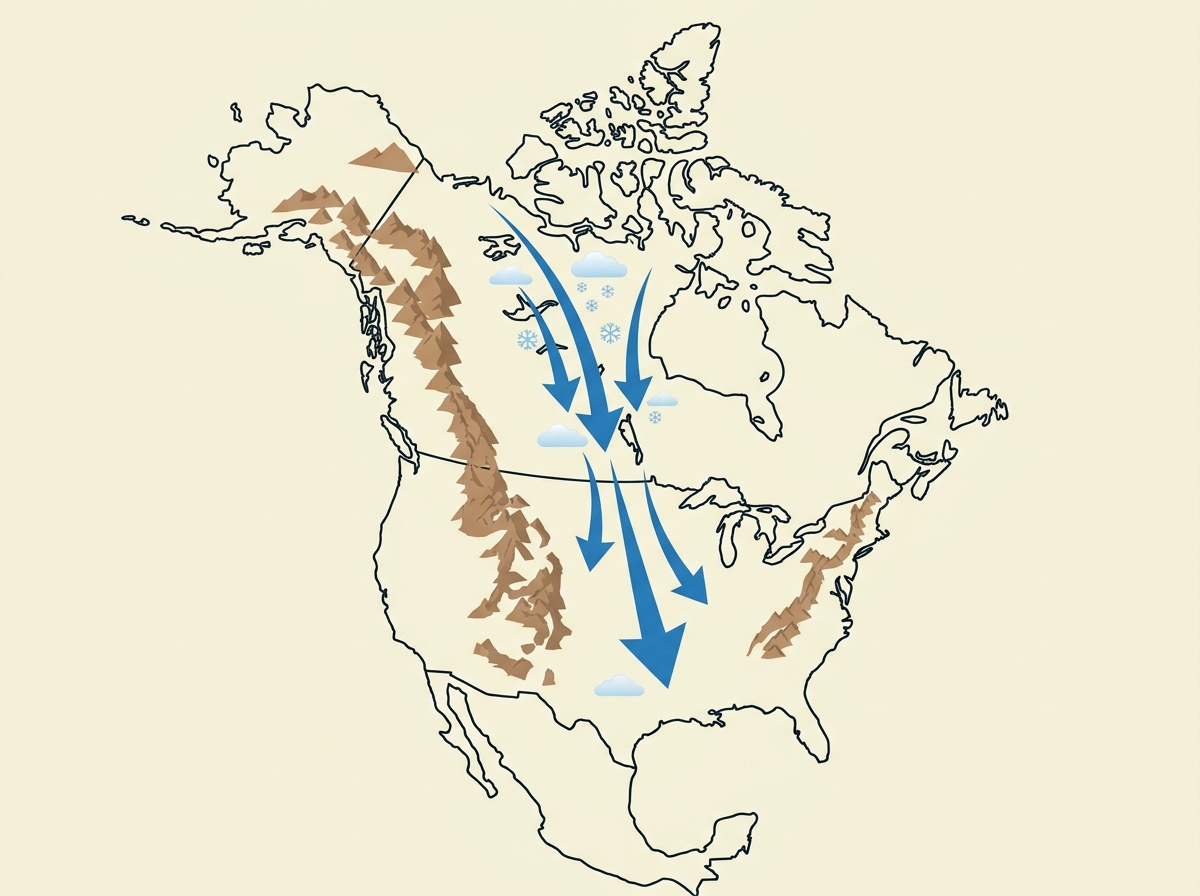
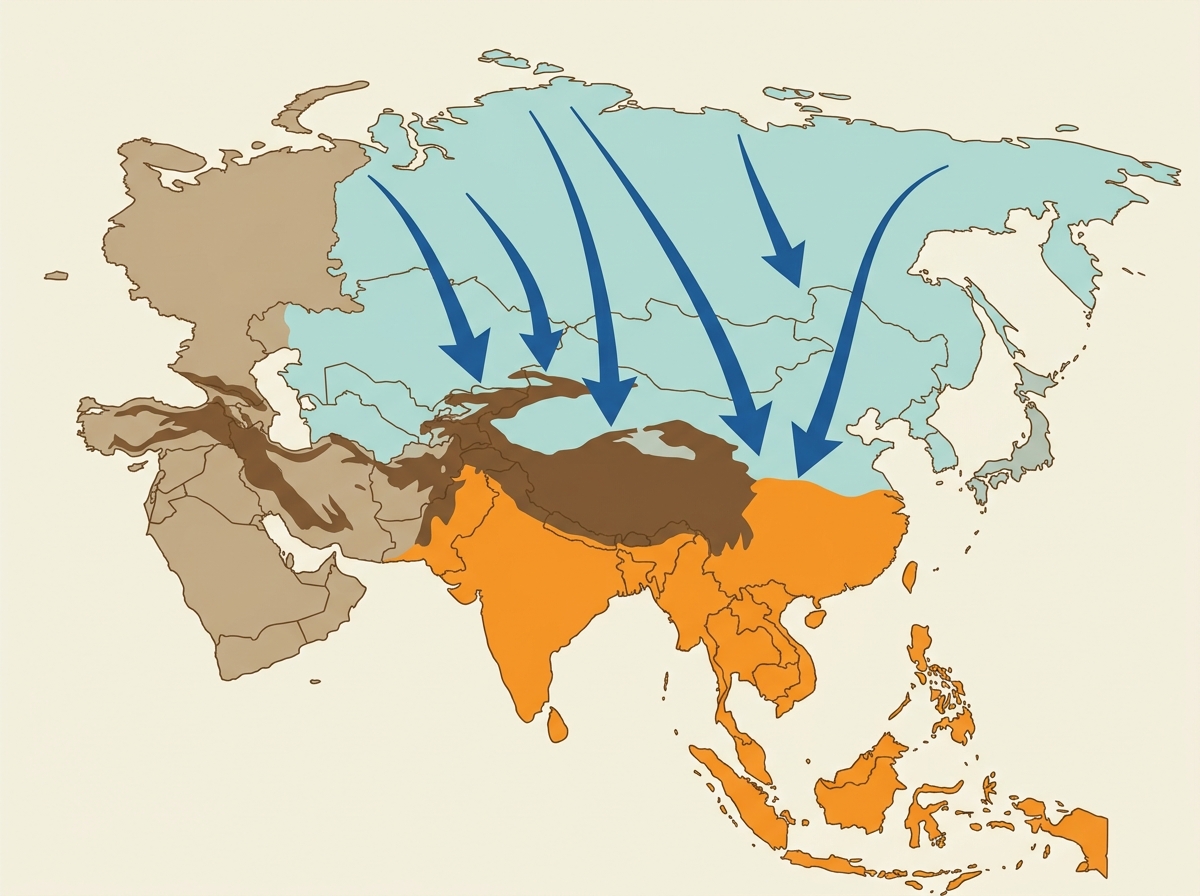
CONTINENTAL
Only in the northern hemisphere (4 seasons)
Short, hot summers above 20°C
Long, freezing winters below 0°C for 3-4 months
<strong>Examples:</strong> Russia, Canada, Central USA
POLAR
Located near the North and South Poles
Warmest months rarely above 10°C
Almost 24hr darkness in winter, very little rainfall
<strong>Antarctica:</strong> winter average minus 40°C
MEDITERRANEAN
Around Mediterranean Sea and Cape Town
Warm, hot, dry summers & cool, wet winters
Popular wine and olive growing regions
<strong>SA Example:</strong> Cape Town
Cape Town has a winter rainfall Mediterranean climate while Johannesburg has a summer rainfall Subtropical climate.
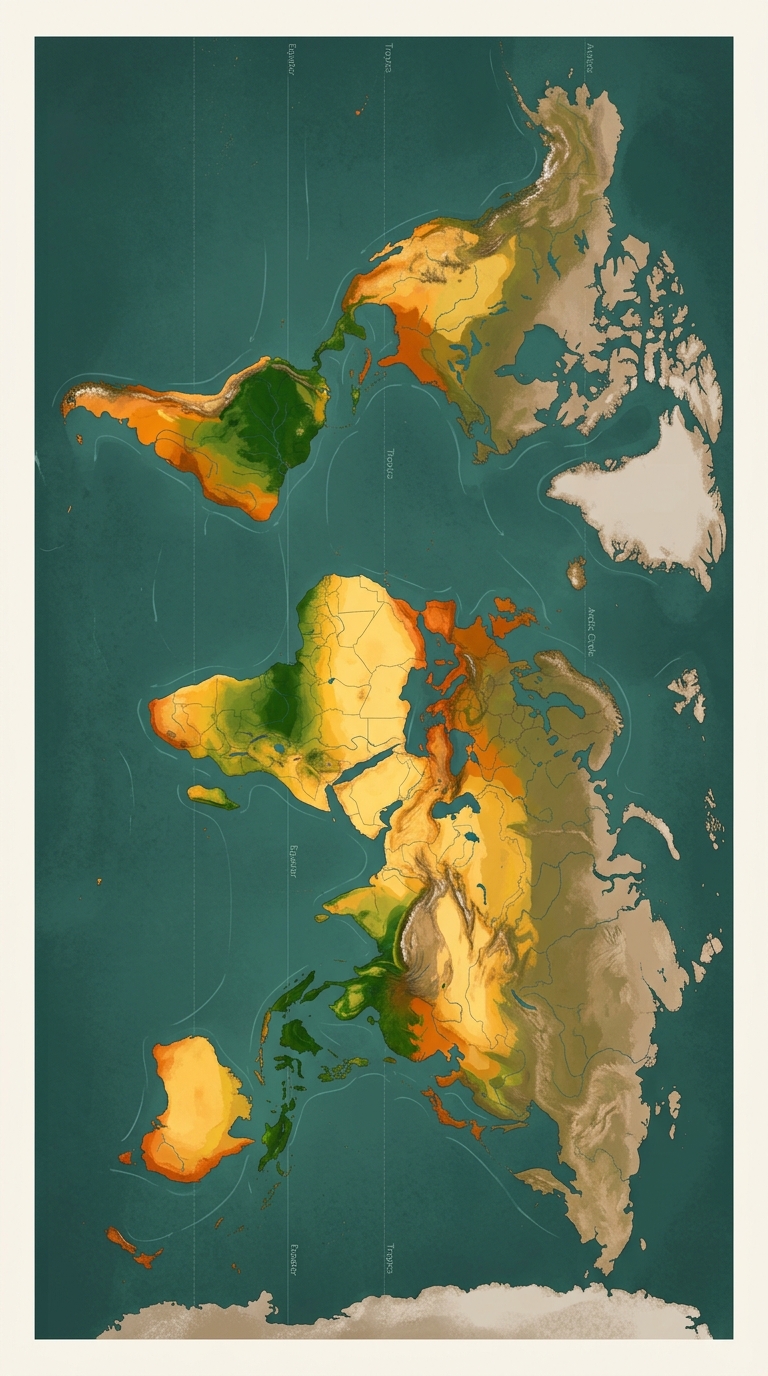
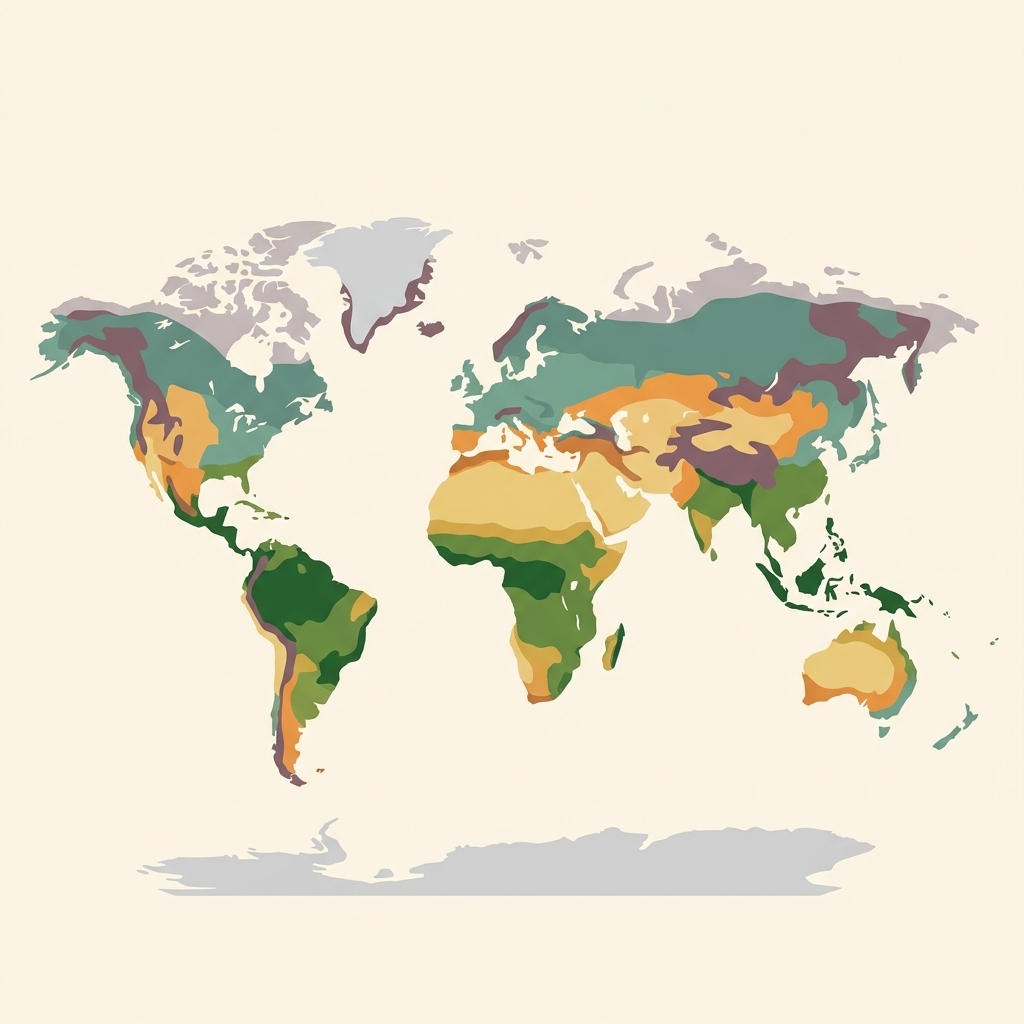
WHERE ARE THE WORLD'S CLIMATE REGIONS?
Each colour shows a different climate type
- geography
- climate-regions
- south-africa-climate
- weather-elements
- latitude
- altitude
- ocean-currents
- education