

Predictive Maintenance: Machine Failure Prediction Analysis
Explore a machine learning study on failure prediction for CNC milling workstations using sensor data, XGBoost, and comparative feature engineering.
Predictive Maintenance: Machine Failure Prediction
Petar Yankov
Project Purpose
Predict machine failure early using raw sensor data
Compare two feature sets: Sensors-Only vs. Sensors + Indicators
Focus: Improving reliability and industrial decision support
Domain Understanding
Context: CNC Milling Workstation
Sensors reflect: Machine load, vibration, and temperature.
Goal: Reduce downtime & prevent expensive, catastrophic failures.
Dataset: AI4I 2020
Source: Synthetic, cleaned dataset (UCI Repository).
Data Quality: No missing values → minimal cleaning needed.
Challenge: Strong class imbalance (approx 97% vs 3%).
Feature Engineering Strategy
Version A: Sensors Only
• Air temperature [K]<br>• Process temperature [K]<br>• Rotational speed [rpm]<br>• Torque [Nm]<br>• Tool wear [min]
Version B: + Indicators
• TWF (Tool Wear Failure)<br>• HDF (Heat Dissipation)<br>• PWF (Power Failure)<br>• OSF (Overstrain Failure)<br>• RNF (Random Failure)
Version A is realistic. Version B includes failure flags (near-target leakage).
Label Analysis: The 0/1 Mismatch
Mismatch: Any Indicator (OR) vs. Actual Target
9643 (Correct)
18 (Indicator present, No Fail)
9 (Fail present, No Indicator)
330 (Correct)
Only 27 total mismatches. Indicators are almost a direct definition of the target.
Failure Type Distribution
Heat Dissipation and Power Failures are the most common causes in this dataset.
Feature Correlations
Strong correlation explains the near-perfect performance of Version B.
Modeling Strategy
Algorithms
• Random Forest<br>• XGBoost<br>• Gradient Boosting
Why?
• Handle non-linear data well<br>• Robust to mixed feature types<br>• Interpretable (Feature Importance)
Imbalance Handling
• Class Weights<br>• Scale Pos Weight (XGB)<br>• No SMOTE used (kept data pure)
Results: Version A (Sensors Only)
• XGBoost performed best overall (Best Balance).<br>• Recall is prioritized to catch failures.<br>• ~98% Accuracy (misleading due to imbalance).
Results: Version B (With Indicators)
• Near-perfect scores across all models.<br>• Confirms that Indicators are proxy labels.<br>• Serves as a theoretical Upper Bound.
XAI, Demo & Reflection
Interpretability (XAI)
Trust is key in industry. Feature Importance helps engineers understand 'Why'.
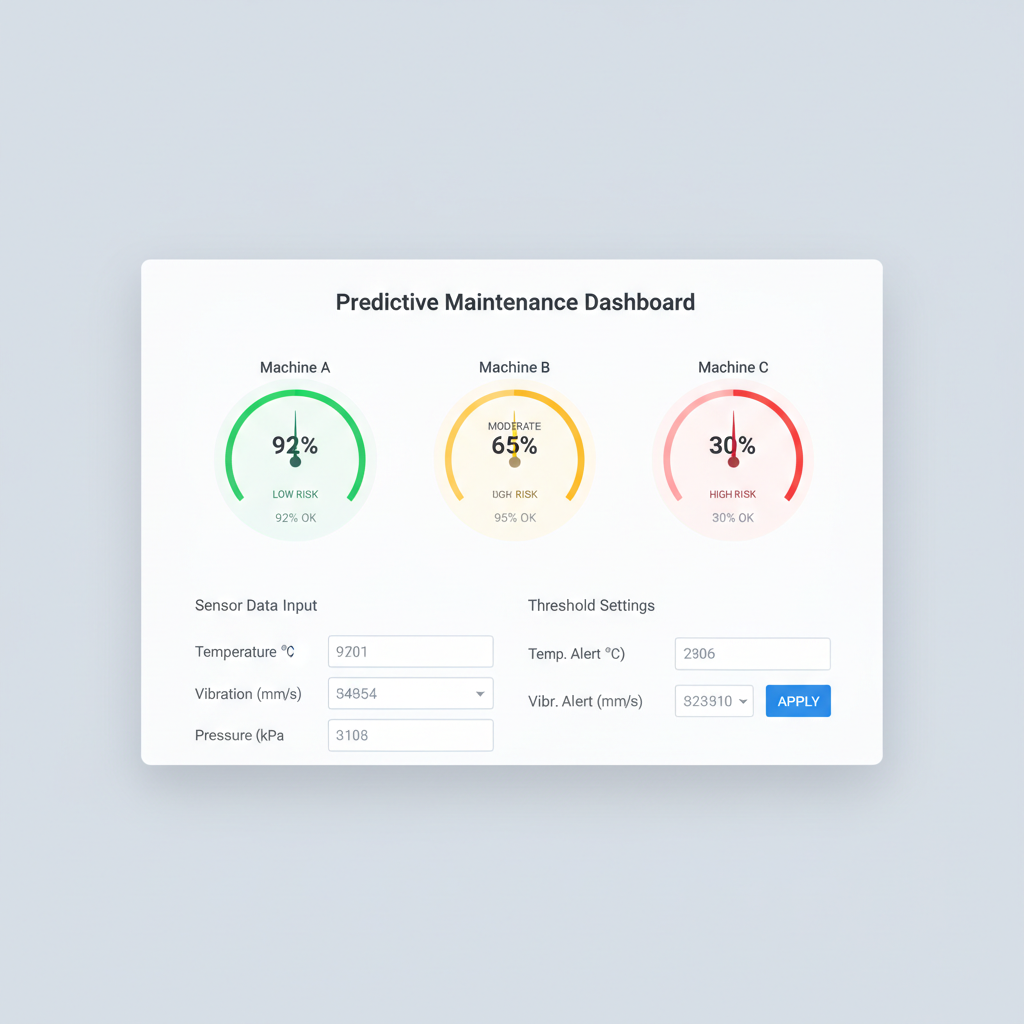
Demo / Prototype
Reflection
✔ Strong comparative analysis<br>⚠ Next: Use real-world time-series data & timestamps.
- predictive-maintenance
- machine-learning
- failure-prediction
- ai4i-2020
- xgboost
- industrial-ai
- data-science