Customer Shopping Behavior Analysis & Retail Insights
Explore retail data insights using Python and Power BI. Learn about customer segmentation, revenue by demographics, and strategic business recommendations.
Customer Shopping Behavior Analysis
Insights into spending patterns, customer segments, and product preferences using Python, SQL, and Power BI.
Dataset Summary
<li><strong>Volume:</strong> 3,900 Rows, 18 Columns</li><li><strong>Demographics:</strong> Age, Gender, Location, Subscription Status</li><li><strong>Purchase Details:</strong> Item, Category, Amount, Season, Size, Color</li><li><strong>Behavior:</strong> Discounts, Frequency, Reviews, Shipping Type</li>
Data Cleaning & Preparation (Python)
<h3>Missing Data Handling</h3><p>Detected 37 nulls in 'Review Rating'. Imputed using the median rating of each product category to maintain statistical integrity.</p>
<h3>Feature Engineering</h3><p>Created 'age_group' by binning ages and 'purchase_frequency_days'. Standardized all column names to snake_case for consistency.</p>
<h3>Database Integration</h3><p>Verified data consistency (dropped redundant 'promo_code_used'). Loaded cleaned DataFrame into PostgreSQL for advanced querying.</p>
Revenue Analysis by Gender
A significant disparity exists in total revenue generation. Male customers contributed over twice the revenue compared to female customers in this dataset.
Top 5 Products by Average Rating
Accessories like Gloves and Hats, along with Footwear (Sandals, Boots), consistently receive the highest customer satisfaction scores.
Subscribers vs. Non-Subscribers
While non-subscribers generate more total revenue due to volume (2,847 vs 1,053 customers), the average spend per transaction is nearly identical (~$59) between groups.
Customer Segmentation Profile
The business heavily relies on 'Loyal' customers (80%+). There is a significant opportunity to convert 'Returning' users into the loyal tier and to improve acquisition of 'New' users.
Revenue Contribution by Age Group
Young Adults differ as the highest revenue contributors ($62k), followed closely by Middle-aged customers. The distribution is relatively balanced, suggesting broad market appeal.
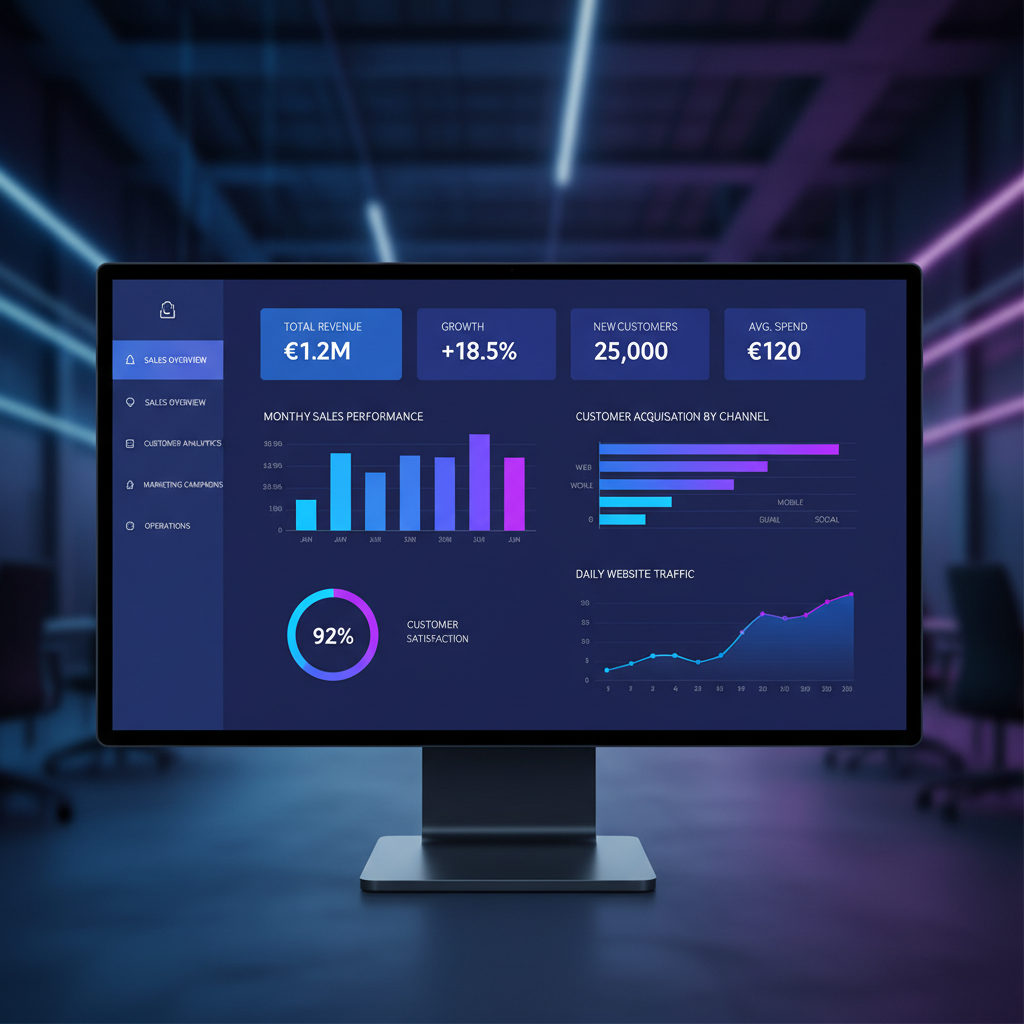
Power BI Dashboard Overview
An interactive dashboard was built to visualize key metrics: Total Customers (3.9K), Average Purchase Amount ($59.76), and Average Review Rating (3.75). It enables dynamic filtering by demographics and behavior.
Strategic Business Recommendations
<strong>Boost Subscriptions:</strong> Develop exclusive benefits or early access features to drive subscription uptake, as current conversion is low.
<strong>Enhance Loyalty:</strong> Implement rewards for repeat buyers to officially move them into the 'Loyal' segment, maximizing lifetime value.
<strong>Targeted Marketing:</strong> Focus campaigns on 'Young Adults' and 'Express Shipping' users who show higher engagement and revenue potential.
<strong>Product Positioning:</strong> Highlight top-rated items (Gloves, Sandals) in hero campaigns to build brand trust.
- data-analysis
- customer-behavior
- retail-analytics
- power-bi-dashboard
- python-data-science
- business-intelligence
- marketing-strategy