


Understanding Chaos Theory: Patterns and the Butterfly Effect
Explore chaos theory, the logistic map, and the Lorenz system. Learn how deterministic math creates unpredictability and the famous butterfly effect.
Chaos Theory
Noah Ghobrial & Jeremy Wu
MHF4U Presentation of Learning | Friday Jan 16 2026
Why can a simple rule make behavior impossible to predict?
How does deterministic math produce apparent randomness?
Today we will cover
What chaos is (Definition)
How chaos appears (Models)
How to tell a system is chaotic (Diagnostics)
Why it matters (Applications)
Activity: Logistic map demo
Core Ideas
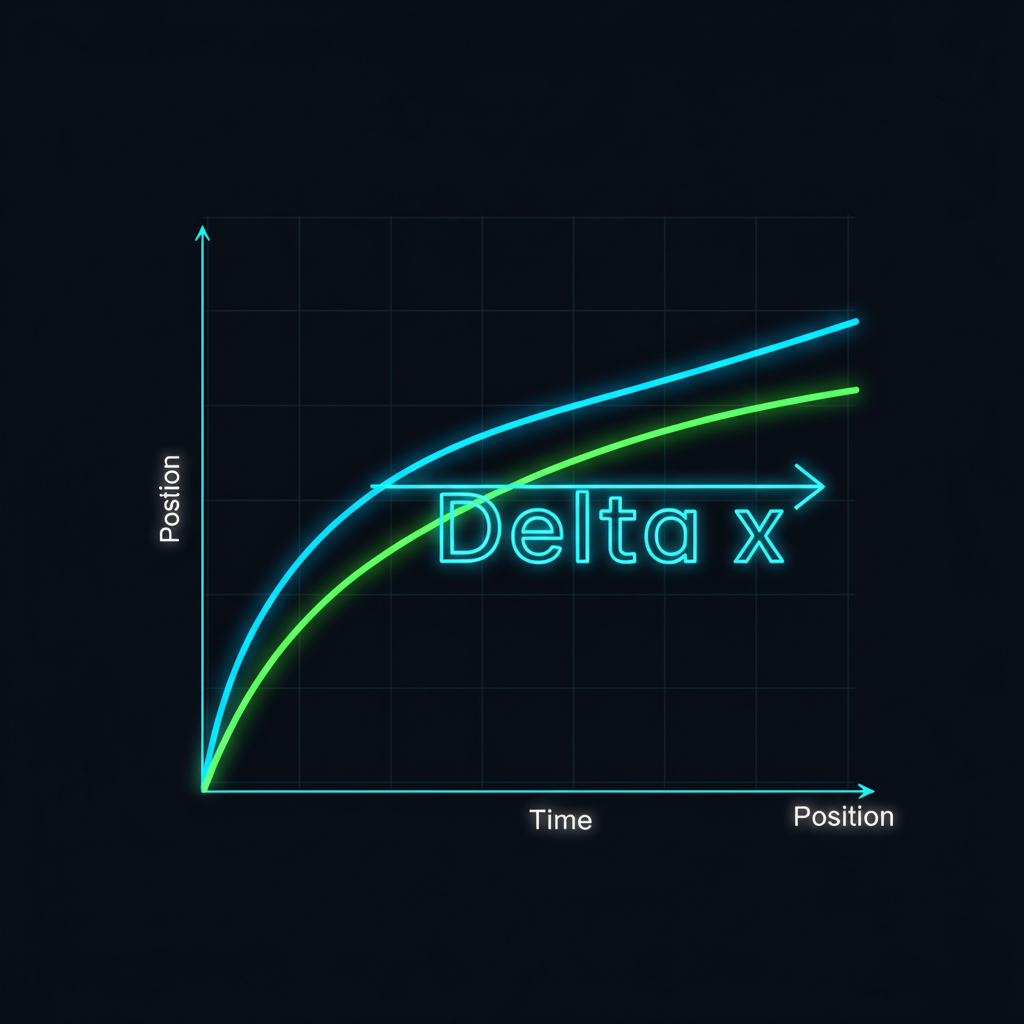
Deterministic rules: outcomes with no randomness<br><br>Sensitivity to initial conditions: tiny differences grow exponentially<br><br>Nonlinearity: outputs do not scale proportionally with inputs<br><br>Strange attractors: hidden structure in long term behavior
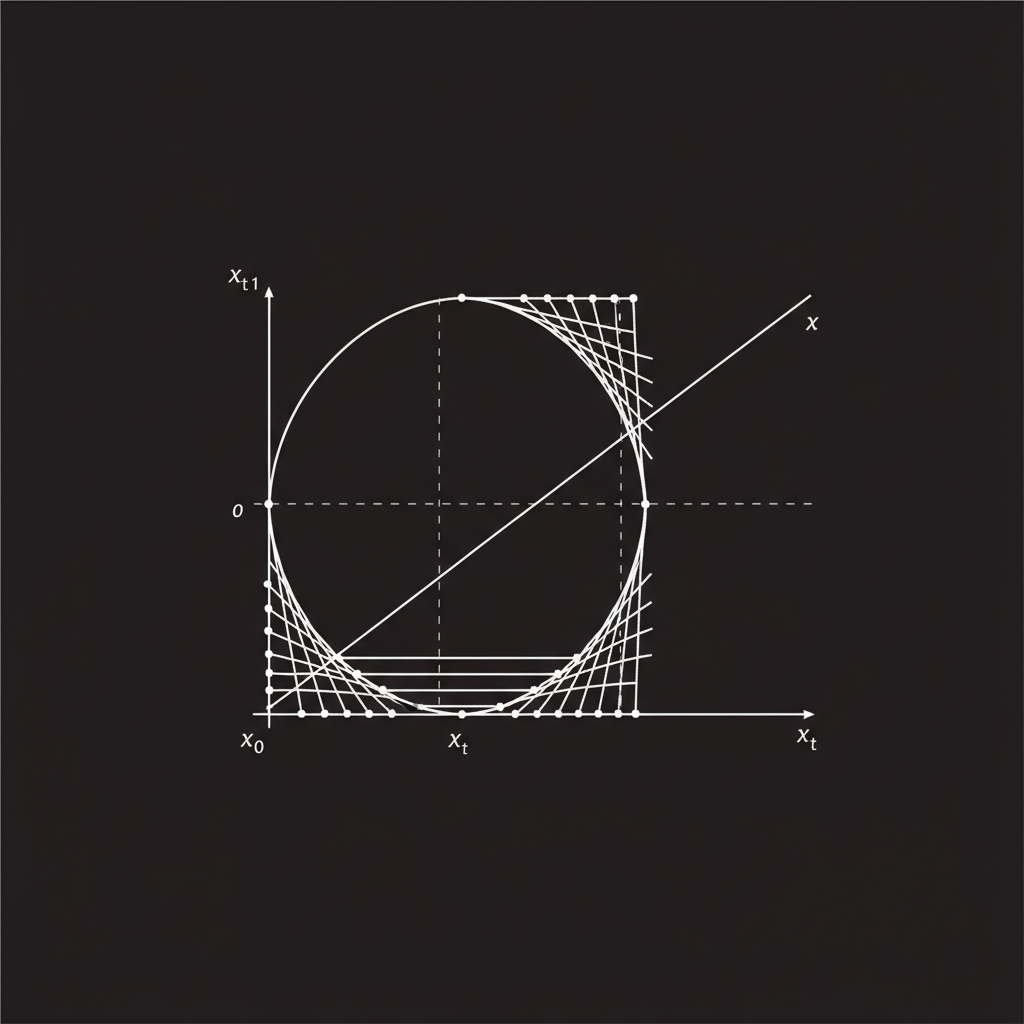
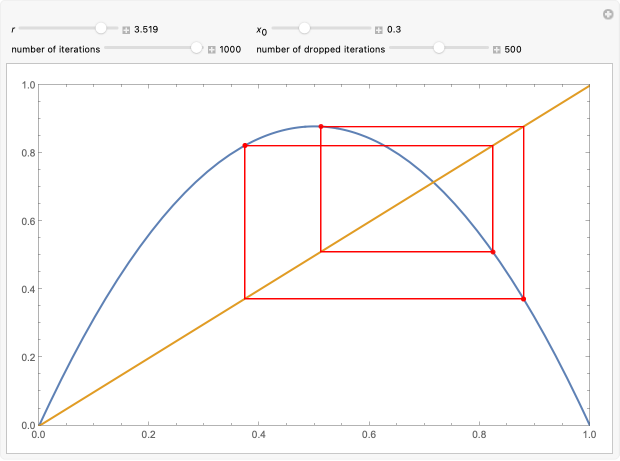
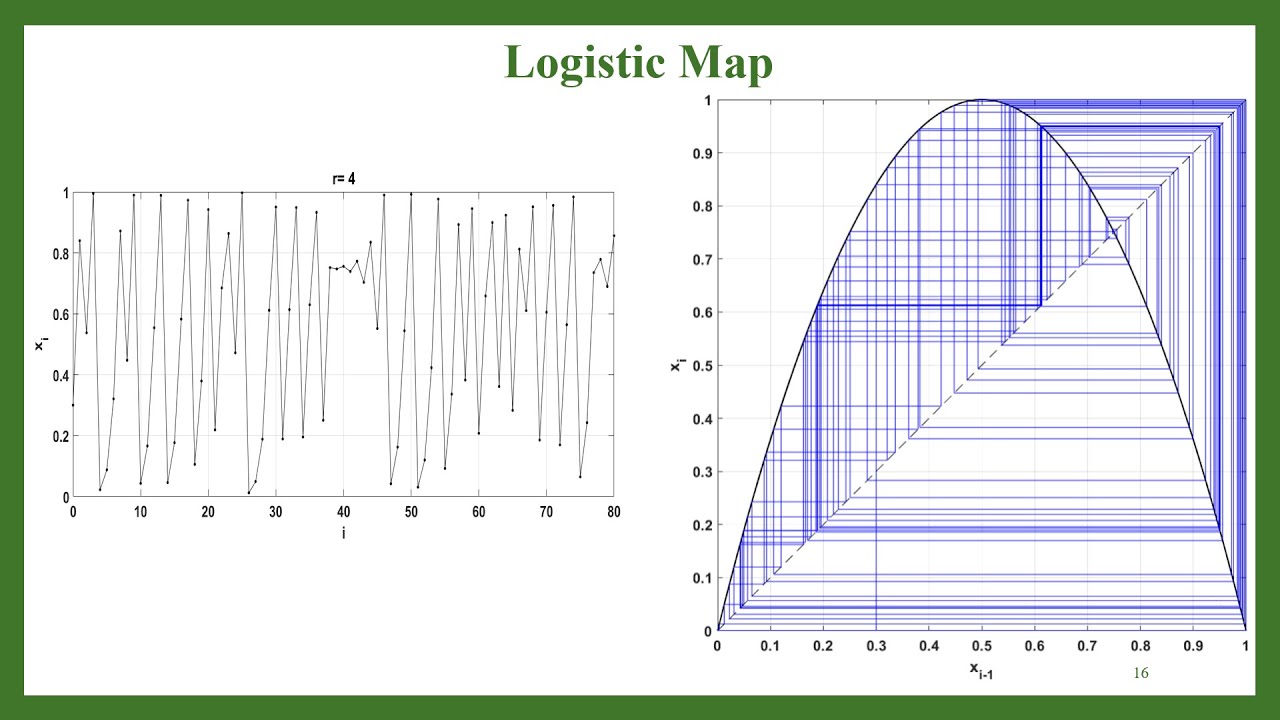
The Logistic Map Equation
<i>x</i><sub><i>n</i>+1</sub> = <i>r x<sub>n</sub></i>(1 − <i>x<sub>n</sub></i>)
Interpretation: xₙ is population fraction; r is growth parameter
Progression as r increases: Stable ➝ Periodic ➝ Chaotic
Let x₀ = 0.2<br>x₁ = 3(0.2)(1-0.2) = 0.48<br>x₂ = 3(0.48)(1-0.48) = 0.7488...
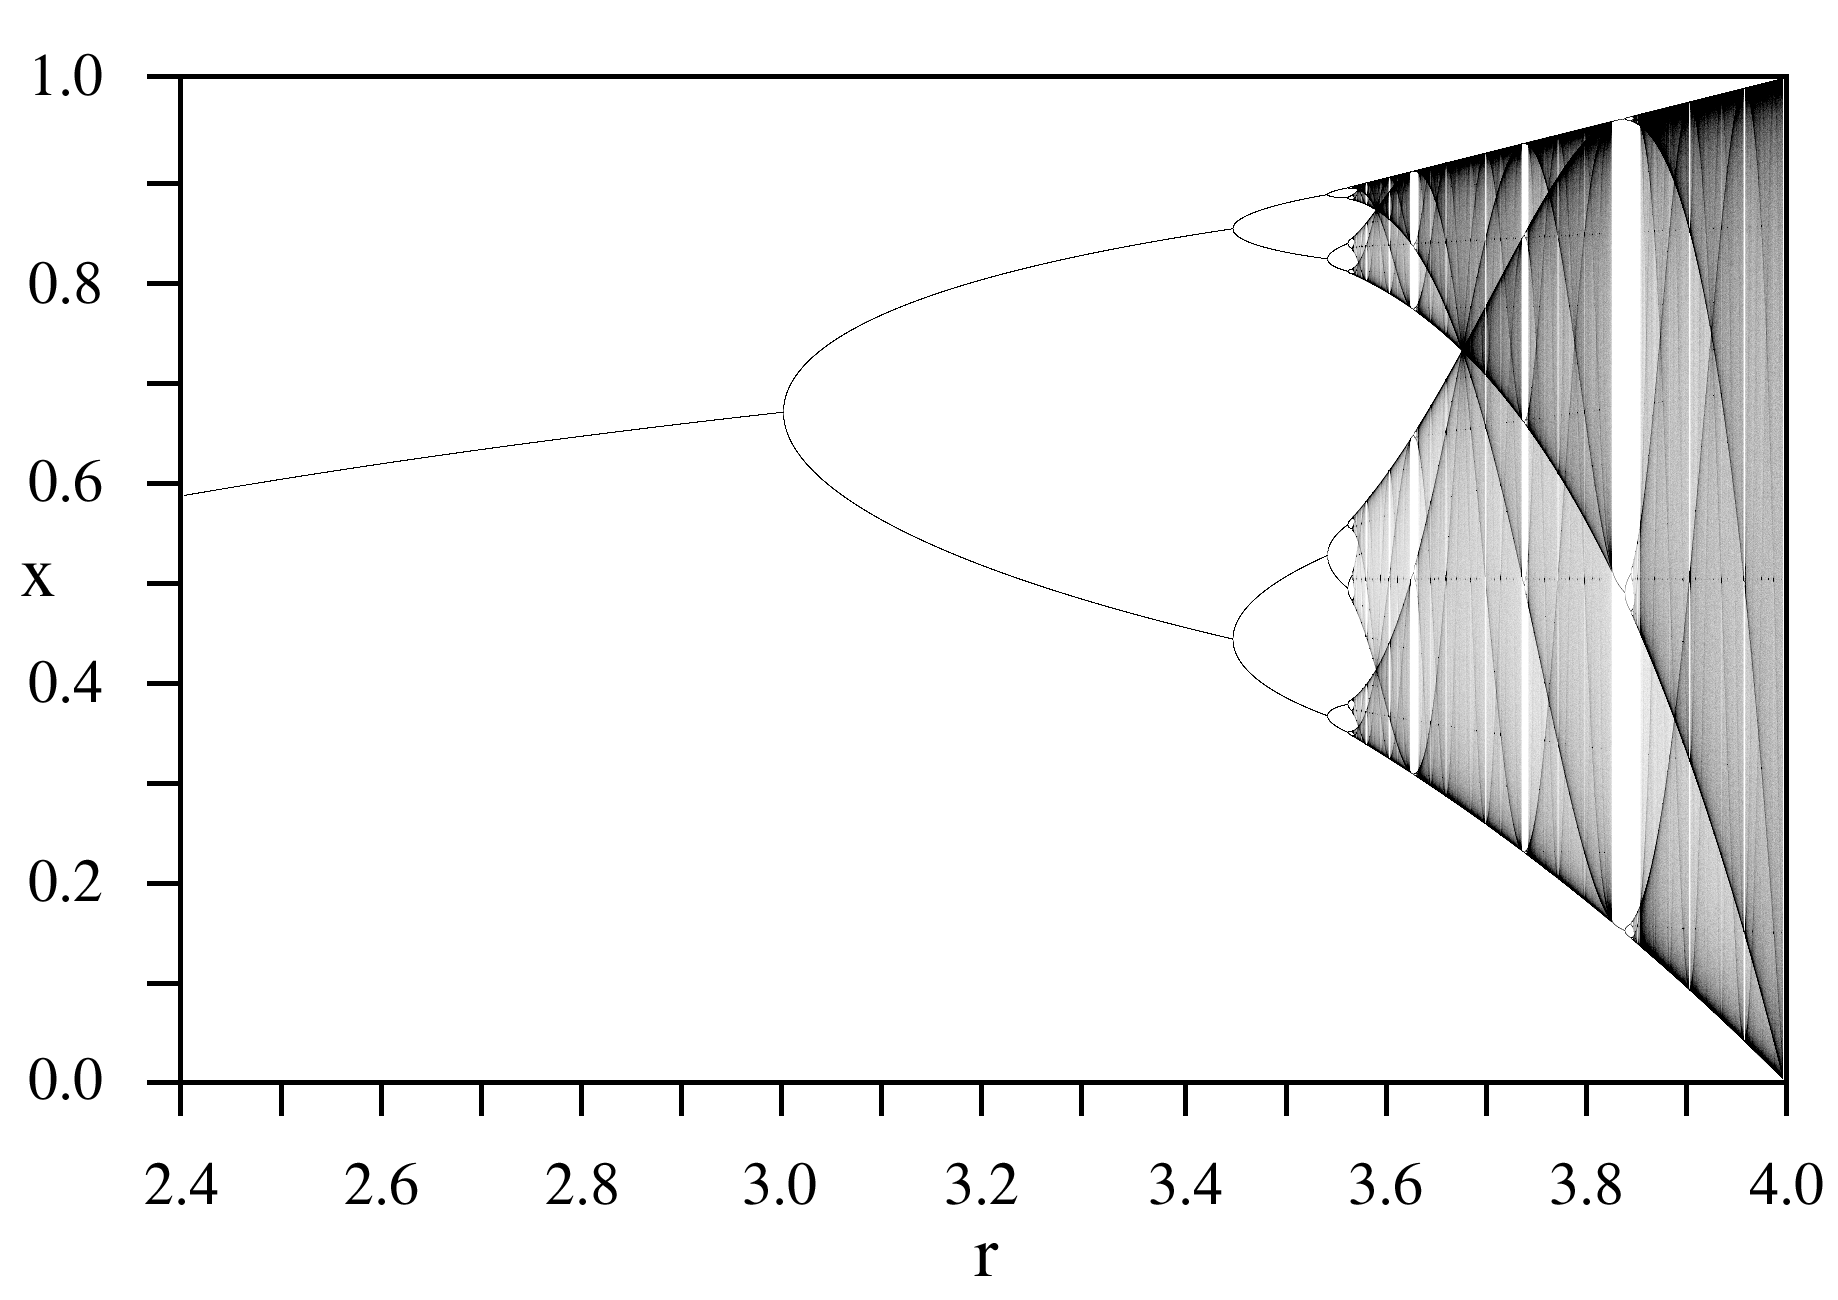
Bifurcation Diagram
As r increases, the long term values of x split into cycles and then chaos.
Activity — Logistic Map (GeoGebra)
1. Pick r between 2.5 and 4.0<br>2. We will switch to GeoGebra and iterate 50 times from x₀=0.2<br>3. Observe behavior: converges, cycles, or chaos.
NOW SWITCH TO GEOGEBRA
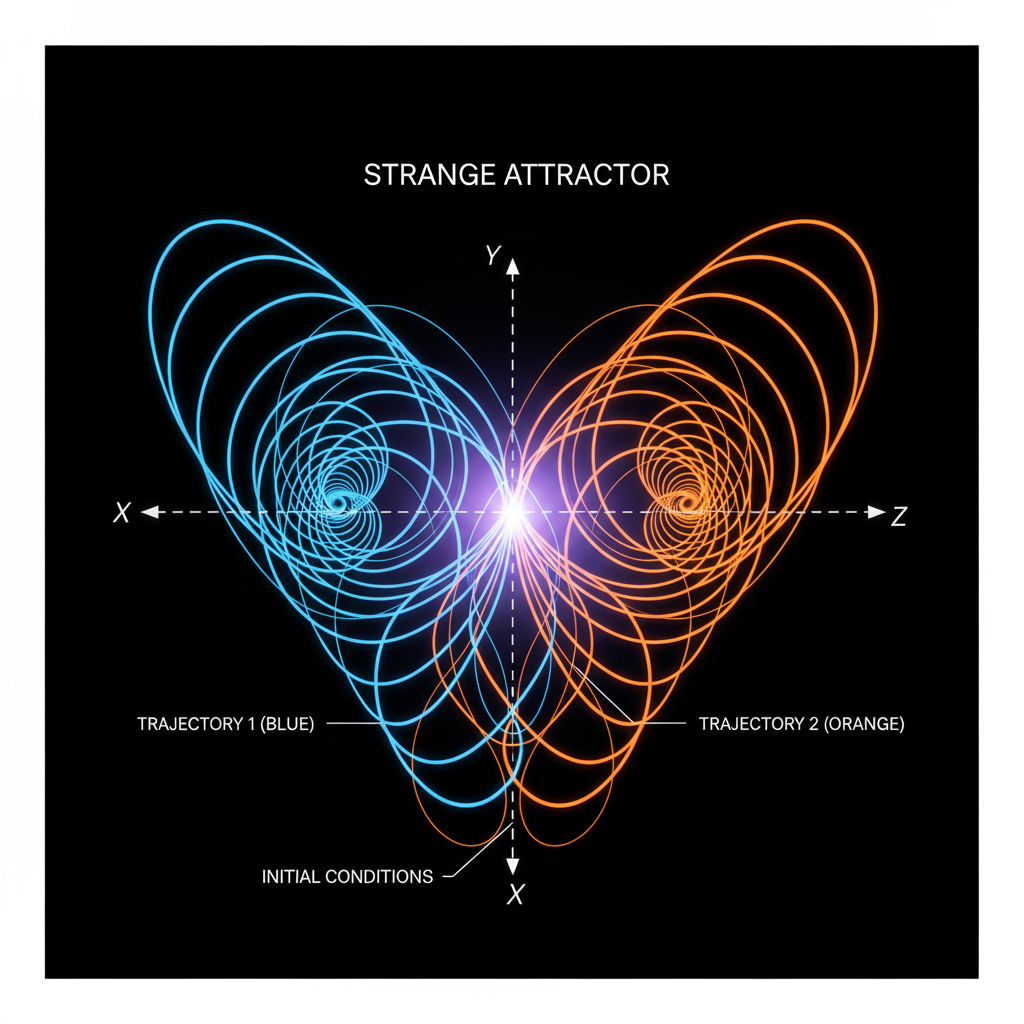
Continuous Example: Lorenz System
<span style='font-style:italic'>ẋ</span> = σ(<span style='font-style:italic'>y</span> − <span style='font-style:italic'>x</span>)<br><span style='font-style:italic'>ẏ</span> = <span style='font-style:italic'>x</span>(ρ − <span style='font-style:italic'>z</span>) − <span style='font-style:italic'>y</span><br><span style='font-style:italic'>ż</span> = <span style='font-style:italic'>xy</span> − β<span style='font-style:italic'>z</span>
Parameters: σ=10, ρ=28, β=8/3
Key Point: Simple ODEs used for weather show the butterfly effect.
How to Detect Chaos
Lyapunov Exponent (λ): Positive value means exponential divergence (sensitivity).
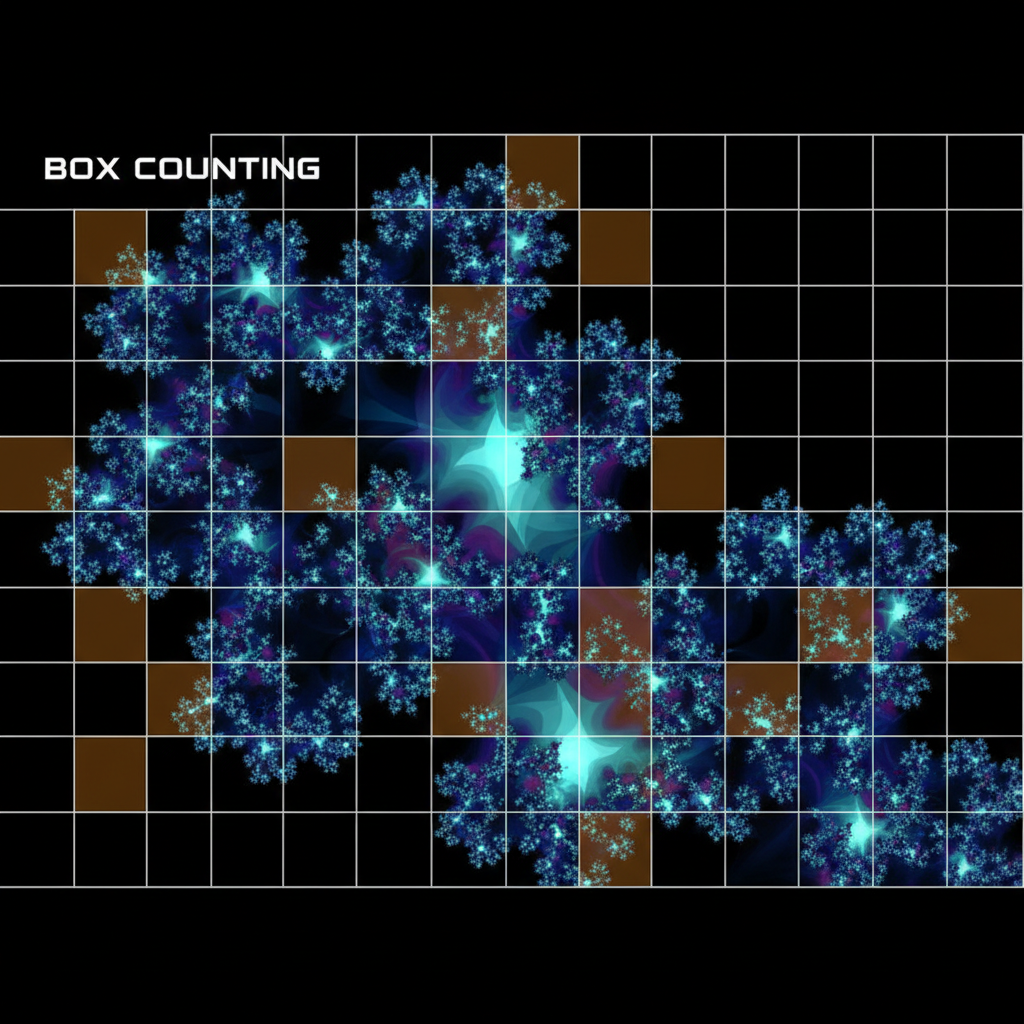
Fractal Dimension: Non-integer dimension implies strange attractor structure.
Poincaré Section: Slicing the 3D flow reveals a structured 2D map.
Routes to Chaos & Limits
• Period Doubling (Feigenbaum) • Quasiperiodicity (Torus breakdown) • Intermittency (Bursts of chaos)
• Noise & Measurement Error • Finite computer precision • Prediction horizon is always limited
Applications
• Weather Forecasting (Ensemble methods)<br>• Ecology (Population dynamics)<br>• Engineering Control (Stabilizing systems)<br>• Secure Communications (Chaos masking)
TAKEAWAY: Chaos reveals structure in apparent randomness and sets fundamental limits on prediction.
Conclusion
• Chaos = Deterministic rules + Practical unpredictability.<br>• Small causes can have huge effects (Butterfly Effect).<br>• Structure (Attractors) exists within the chaos.
References
- chaos-theory
- mathematics
- butterfly-effect
- lorenz-system
- logistic-map
- nonlinear-dynamics
- science-education