


Paris Urban Mobility: Navigo Validation Data Analysis
Explore insights from Paris transit data (Q4 2024). Analysis covers weekly rhythms, event impacts, and transport mode distribution in Île-de-France.
Urban Mobility in Paris: Navigo Validation Analysis
Daily Trends, Network Stability, and Event Impact (Q4 2024)
Data Visualization Project - Fall 2025 | Source: Île-de-France Mobilités
Introduction & Context
Subject: Monitoring mass transit usage in Île-de-France (Metro, RER, Train).
Source: Île-de-France Mobilités (IDFM) Open Data Portal (PRIM).
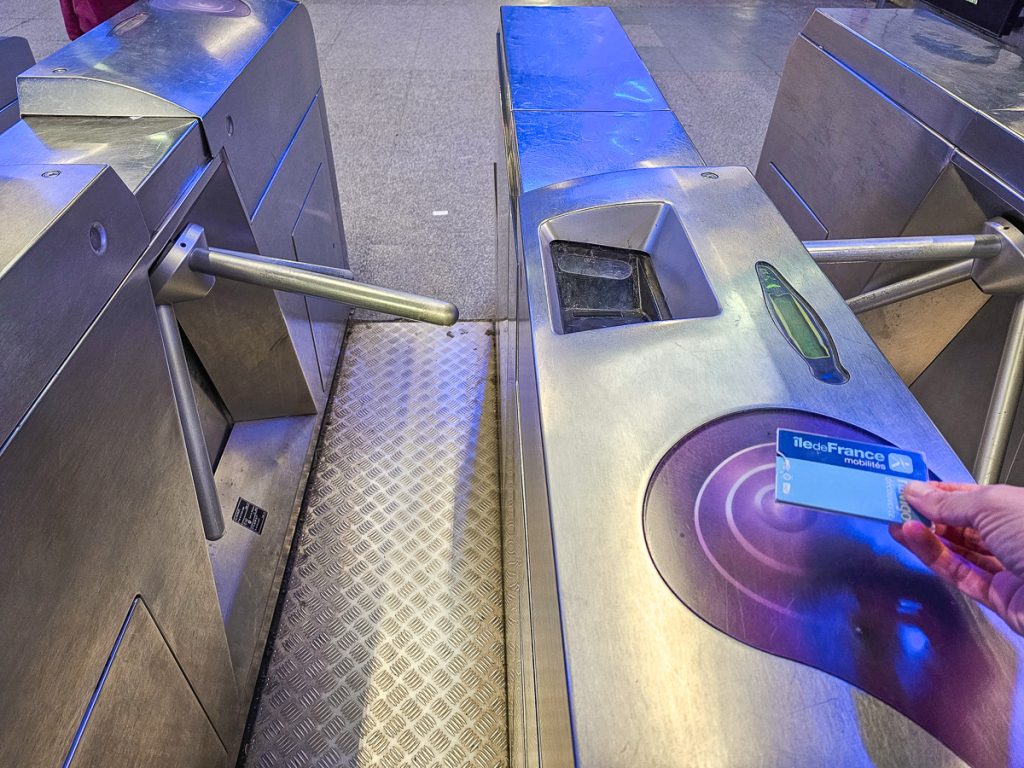
Collection Methodology: Automated 'Navigo' validation counts (turnstile logs).
Observation Window: Daily data from November 12 to December 16, 2024.
Dataset Description
Variable Dictionary
jour (Date)
Timeline reference for daily aggregation.
nb_vald (Int)
Quantitative volume of validations.
categorie_titre
Ticket class (e.g., Commuter IMAGINE R vs Student).
Research Question & Strategy
Core Inquiry
How do validation patterns reflect daily behavior, and how are they affected by temporal factors?
1. What is the baseline 'Weekly Rhythm' of the network?
2. Do 'Events' (strikes/holidays) cause statistically significant disruptions?
Hypothesis: The network is rigid (M-F) and highly sensitive to disruptions.
Analysis 1: The Weekly Rhythm
Weekdays average ~4.5 Million validations; Weekends drop to ~2.1-2.5 Million.
The 50% weekend drop confirms the network is driven by work/school commuters.
Supplemental Analysis: Mode Distribution
Understanding the dataset composition by transport mode is crucial for interpreting scale.
The Metro accounts for the majority of short-distance inner-city travel.
Analysis 2: Event Impact Detection
Method: Dual-Axis Combo Chart comparing Daily Volume (Bars) vs 7-Day Trend (Red Line).
Significant deviations (red bar) flag network disruptions without needing external news sources.
Spatial Context: Network Hubs
While the primary analysis tracks network totals, station-level data reveals critical bottlenecks.
Hubs like Gare du Nord and Châtelet-Les Halles drive nearly 15% of total dataset volume.
Future work: Heatmap analysis of these spatial nodes.
Transport Mode Analysis
The Metro network remains the backbone of Parisian transit, handling the majority of daily short-distance validations.
Metro Share
~60%
Passenger Segments
Limitations & Methodology Assessment
Temporal Granularity
Data is Daily, not Hourly. We cannot analyze 'Rush Hour' saturation or peak times.
Validation Bias
Passes are tapped on Entry, rarely on Exit. This prevents Origin-Destination (OD) matrix creation.
Geographic Scope
Private bus lines (Optile) in outer suburbs are inconsistent in the dataset.
Conclusion
Paris mobility follows an industrial, predictable M-F rhythm.
The network is highly sensitive; disruptions cause traffic to plummet to weekend levels.
Data visualization acts as a diagnostic tool, turning raw counts into an instant health check for the city's transport network.
- paris-transit
- navigo-data
- urban-mobility
- data-visualization
- public-transport
- ile-de-france-mobilites
- metro-usage