


Foundations of Trading: A Beginner's Guide to Markets
Learn trading basics: market mechanics, technical analysis, risk management, and psychology. A complete beginner's course on stocks, forex, and crypto.
Foundations of Trading
Beginner Course: Markets, Mechanics & Mindset
What Is Trading?
Trading is the active buying and selling of financial instruments with the goal of profiting from price movements. Unlike investing, it focuses on short-to-medium term opportunities.
• Activity: Buying & Selling financial assets
• Goal: Capitalize on volatility and price shifts
Trading vs. Investing
TRADING
Short–medium term (Minutes to Weeks). Active management requiring daily attention.
INVESTING
Long term (Years to Decades). Passive approach focusing on wealth accumulation.
Market Ecosystem
TYPE OF MARKETS
• Forex (Currencies)<br>• Stocks (Equity)<br>• Crypto (Digital)<br>• Commodities (Gold/Oil)
PARTICIPANTS
• Banks & Institutions<br>• Hedge Funds<br>• Market Makers<br>• Retail Traders (You)
Trading Instruments
A trading instrument is simply the asset you buy or sell. Each class has unique characteristics.
FOREX PAIRS: EUR/USD, GBP/JPY (High Liquidity)
STOCKS: Apple, Tesla, Amazon (Company Performance)
CFDs: Contract for Difference (Trade price without owning asset)
Market Mechanics
SPREAD: The difference between the Buy (Ask) and Sell (Bid) price. This is the broker's fee.
LEVERAGE: Borrowing capital to increase position size. Increases both profit potential and risk.
LIQUIDITY: How easily an asset can be bought or sold without affecting price.
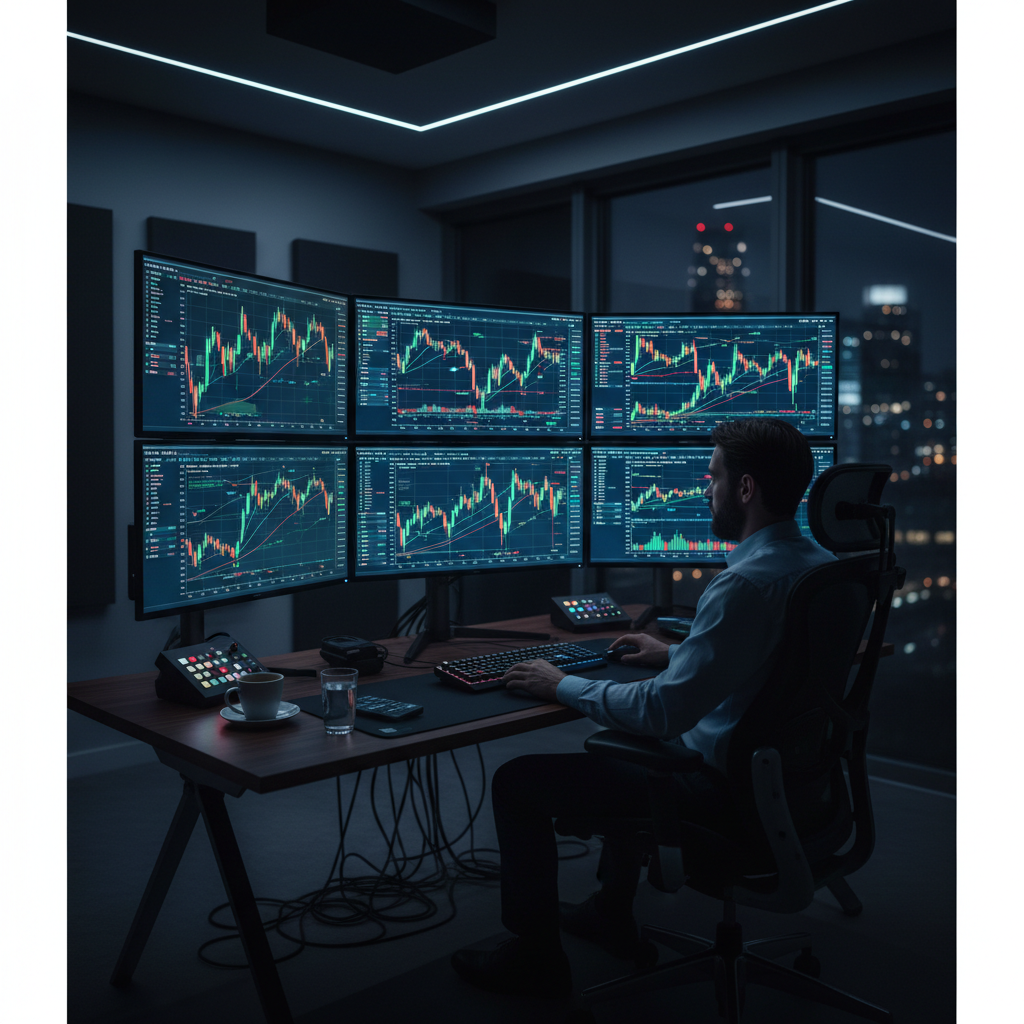
Platforms Setup
Your window to the markets. Most traders use dedicated charting software alongside their broker's execution platform.
TradingView: Best for analysis, drawing, and clean data.
MetaTrader 4/5: The industry standard for executing trades (especially Forex).
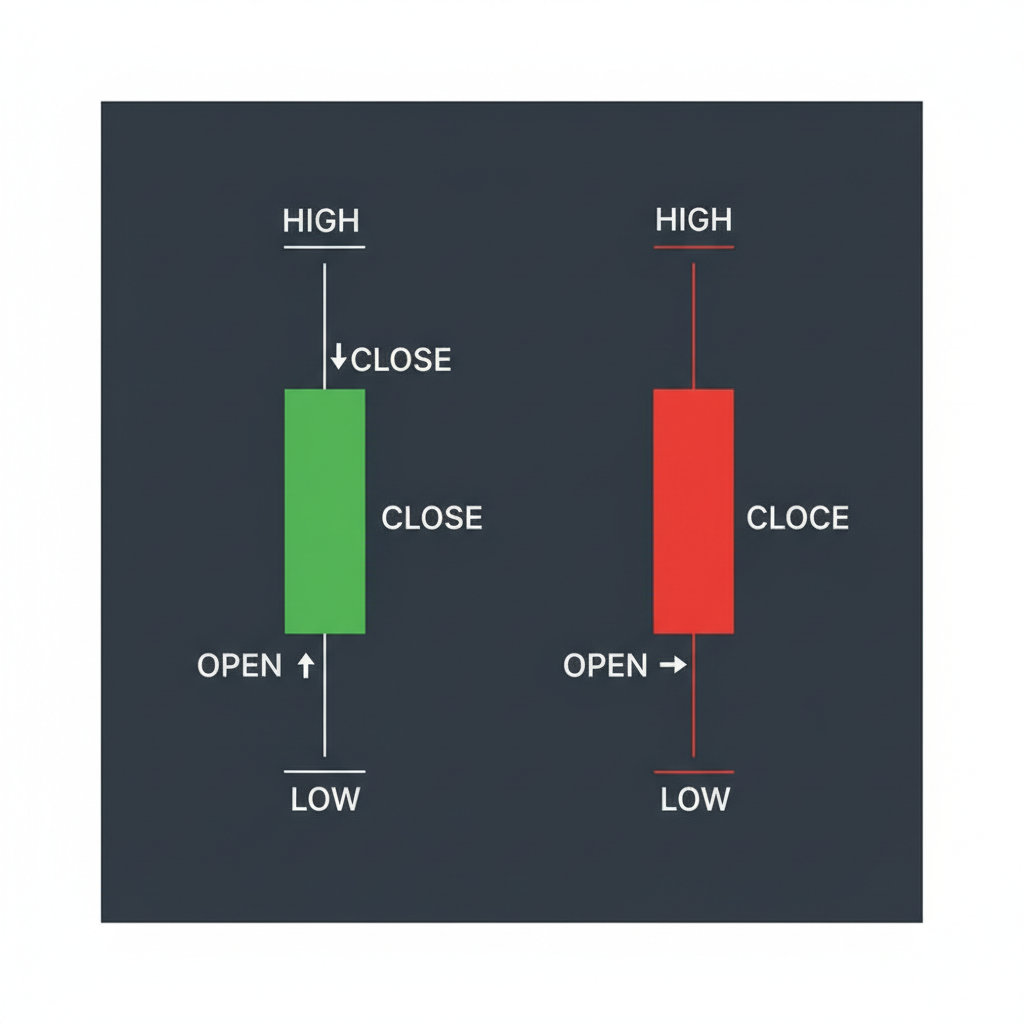
Candlestick Anatomy
The language of price action. Each candle represents a specific timeframe.
• BODY: The range between Open and Close.<br>• WICK (Shadow): The High and Low extremes.<br>• COLOR: Green = Price went UP (Bullish). Red = Price went DOWN (Bearish).
Market Structure & Trends
UPTREND
Defined by Higher Highs (HH) and Higher Lows (HL).
DOWNTREND
Defined by Lower Highs (LH) and Lower Lows (LL).
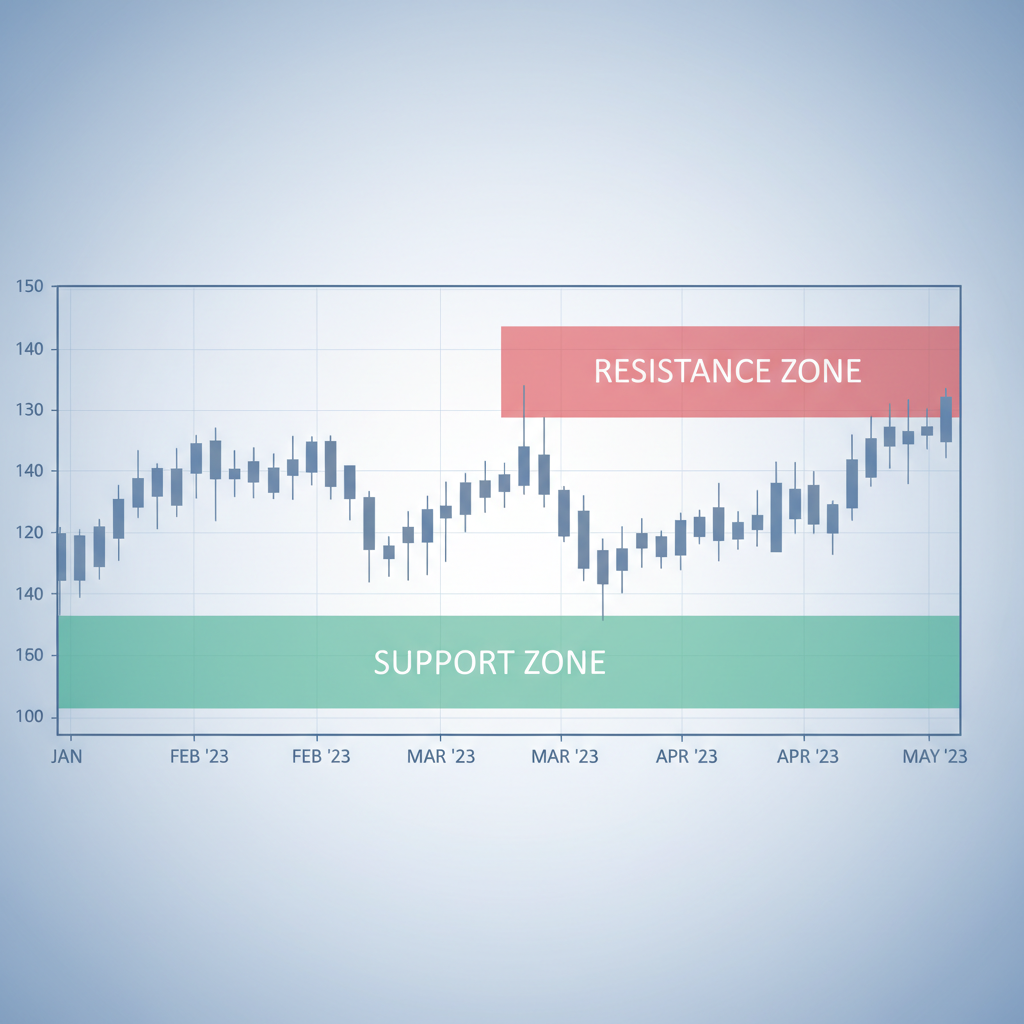
Support & Resistance
These are not single lines, but 'zones' where price is likely to react.
SUPPORT: The 'floor' where buying pressure overcomes selling pressure.
RESISTANCE: The 'ceiling' where selling pressure overcomes buying pressure.
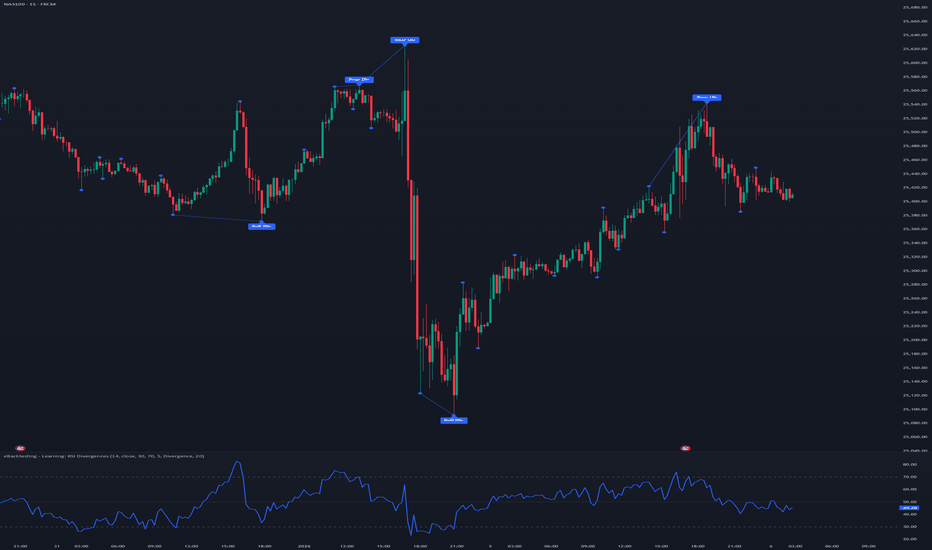
Indicators Basics
Indicators are mathematical calculations based on price and volume. They help confirm trends, not predict the future.
Moving Averages (MA): Smooths out price data to identify trend direction.
RSI (Relative Strength Index): Measures momentum. >70 is Overbought, <30 is Oversold.
Beginner Strategies
1. TREND PULLBACK
Identify an uptrend, wait for price to drop (pullback) to a support level or moving average, then buy.
2. RANGE BOUNCE
In a sideways market, buy at the bottom support and sell at the top resistance.
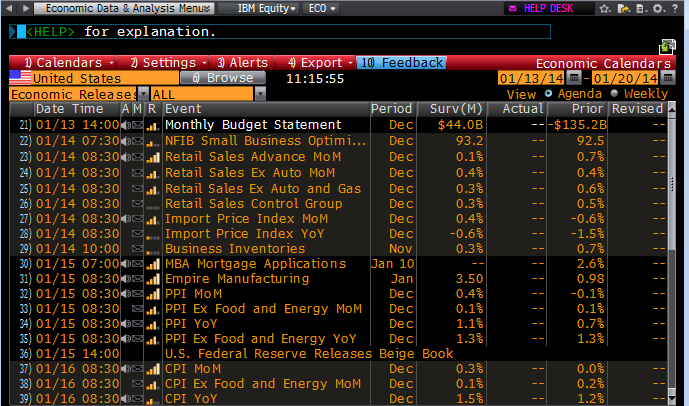
Fundamental Analysis
While technicals look at the chart, fundamentals look at the 'why' behind the move.
Economic Data: Interest Rates, Inflation (CPI), Employment (NFP).
Geopolitics: Wars, elections, and trade policies affect currency and oil prices.
News Trading: Volatility spikes when data is released. Beginners should avoid 'Red Folder' (high impact) events initially.
Risk Management: The #1 Rule
The 1–2% Rule
Never risk more than 1–2% of your total account balance on a single trade. If you have $1,000, your max loss per trade should be $10–$20.
Survival > Profit. This rule prevents a losing streak from wiping out your account.
Risk to Reward Ratio
Minimum 1:2
RISK $100 to MAKE $200
With a 1:2 ratio, you can be wrong 60% of the time and still be profitable. It removes the pressure to be perfect.
Trading Psychology
Mindset is 80% of the game.
FEAR: Causes you to close winning trades too early or hesitate to enter.
GREED: Causes you to over-leverage, hold losers too long, or chase price.
REVENGE TRADING: Trying to make back a loss immediately. Usually leads to bigger losses.
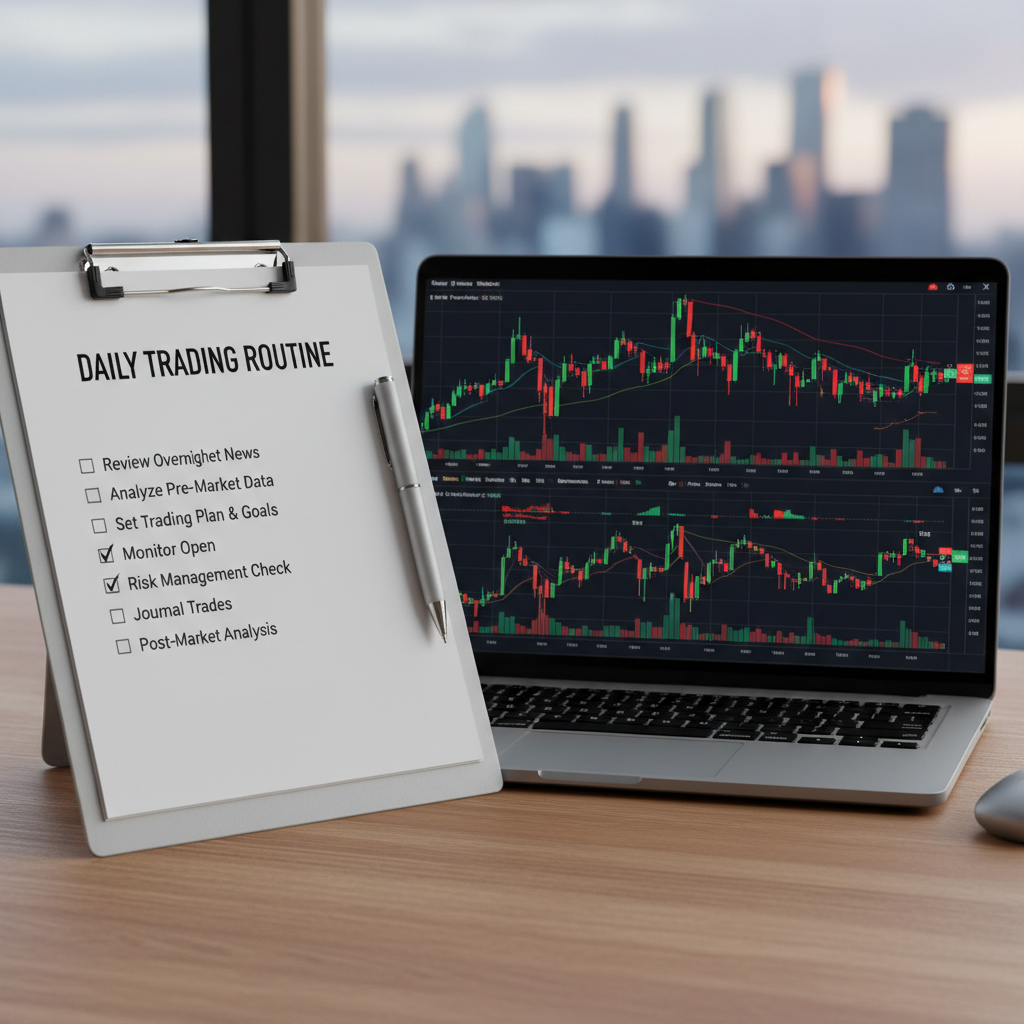
The Trading Plan
Treat trading like a business. No plan = Gambling.
1. WHAT to Trade? (Asset list)
2. WHEN to Enter? (Strategy rules)
3. WHEN to Exit? (SL and TP)
4. HOW MUCH Risk? (Lot size)
Journaling & Review
Record Every Trade: Screenshot the chart before and after.
Log Emotions: Were you nervous? Confident? Bored? Emotional state affects performance.
Review Weekly: Identify patterns in your losses. Are you trading against the trend? Is your stop loss too tight?
Transition to Live Trading
1. DEMO FIRST: Prove you can be profitable with fake money for at least 3 months.
2. BROKER CHOICE: Ensure they are Regulated (ASIC, FCA, etc.) and have low fees.
3. START SMALL: Deposit an amount you can afford to lose. Psychology changes when real money is at risk.
Course Summary
Trading is a marathon, not a sprint. Success comes from risk management, discipline, and continuous learning.
✓ Protect your capital first
✓ Master one simple strategy
✓ Control your emotions
- trading-fundamentals
- technical-analysis
- risk-management
- forex-beginner
- stock-market
- trading-psychology